Cardano investors could be in for a high-profile win this year, according to analyst Christopher Visser, who sees ADA approaching a critical breakout point after years of consolidation.
Follow @Lachakari_Crypto
In recent video updates on X, Visser pointed to multiple technical indicators that he said aligned to create a rare bullish setup.
Currently, ADA is trading at $0.8526, up 9.0% in the past day, as it extends its weekly rally to 18%. On the daily chart posted by the analyst, the token has been moving within a massive wedge pattern, bound by a descending resistance line dating back to 2021 and a long-term support base near $0.23.
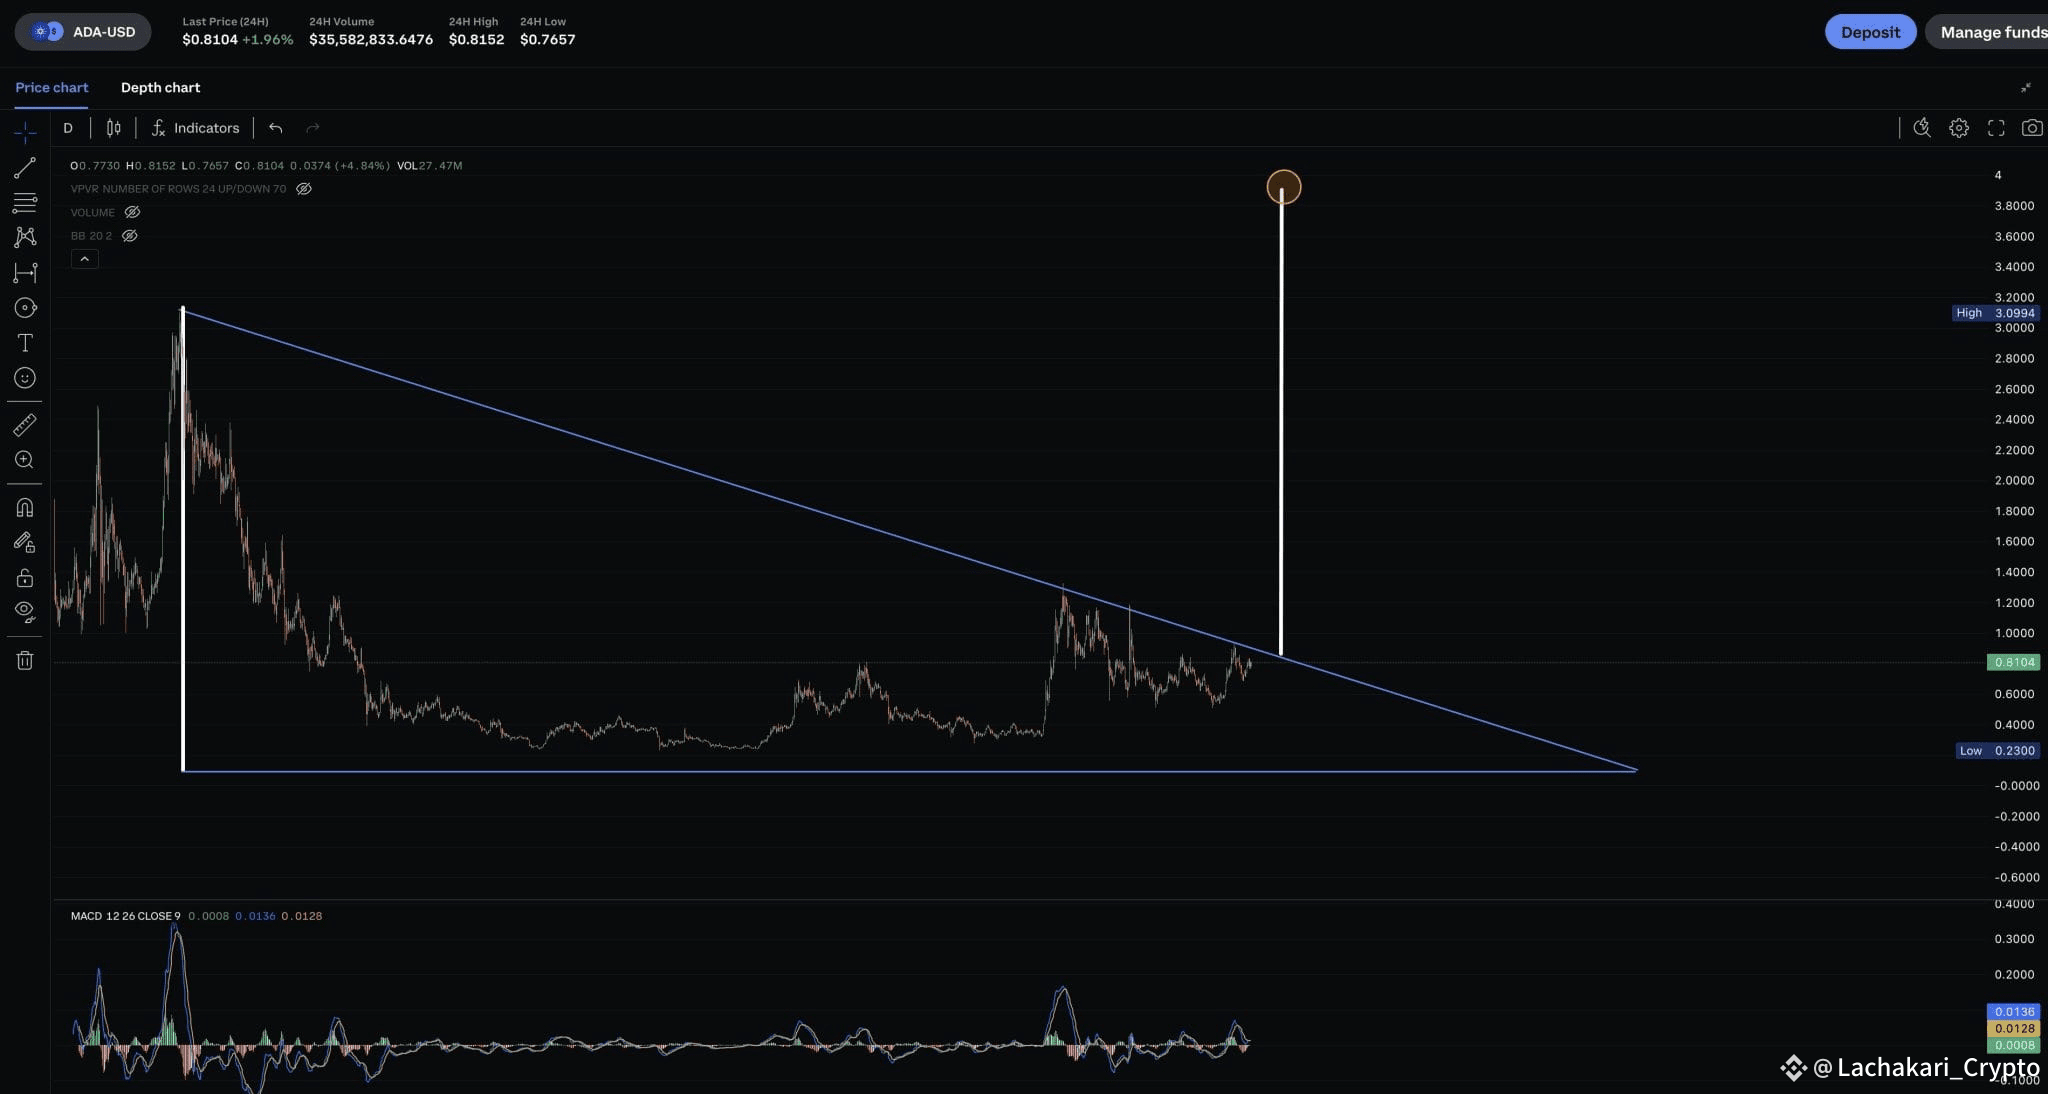
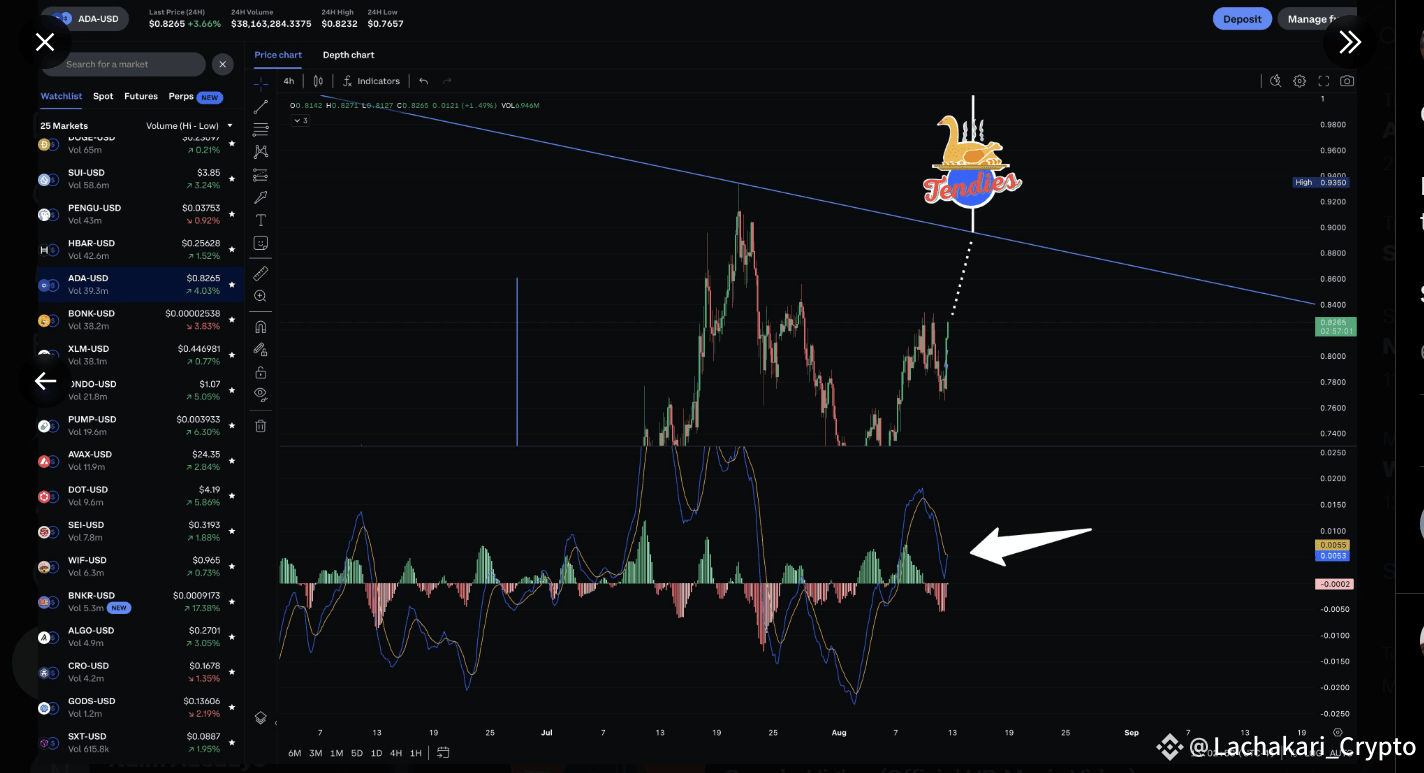
The current price action places ADA just below that resistance line, estimated in the $0.88–$0.92 zone, suggesting that the market is on the verge of testing a structural barrier that has capped every major rally since the peak.
Cardano’s Positive Momentum Signals
Notably, Visser stated that the daily moving average convergence divergence (MACD) crossed bullish earlier this week. The last daily cross, recorded around June 28–29, preceded a price increase of about 62%.
At the time of his latest update, the analyst noted that the two-hour MACD had already crossed, the four-hour was going to happen, and the six-hour was “kind of close.”
Visser noted that in the previous rally, the daily, four-hour, and six-hour MACD crossovers all occurred on the same day. He said the current setup is “almost identical” to that scenario.
Cardano Bollinger Bands Show Volatility Compression
Meanwhile, Visser highlighted a volatility squeeze on the six-hour Bollinger Bands. He explained that the bands become tighter when the price is near their middle line, and such compression is less common on higher timeframes.
On his chart, the middle orange line was positioned around $0.7975 to $0.8051, less than one cent wide. He said that if the price holds near the middle for another three hours, the bands could tighten further. In previous instances, tight Bollinger Bands preceded sharp upward moves.
Cardano Price Approaches Long-Term Resistance
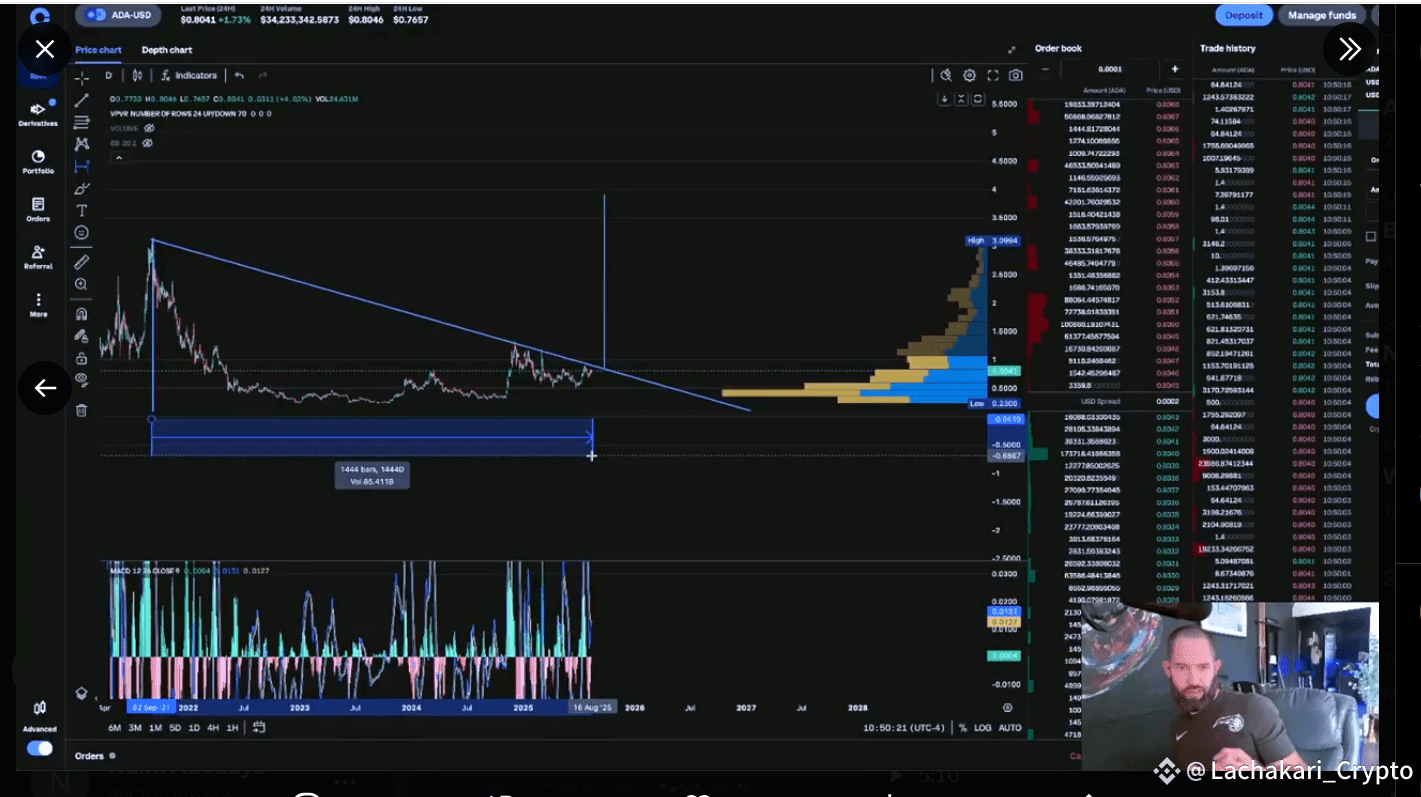
Visser also placed ADA’s current price action in a broader historical context. According to his chart, Cardano has spent the last four years in a consolidation phase. Price has attempted to break out twice during that time and is now approaching a third attempt. Notably, ADA reached $1.63 and $1.32 in 2022 and 2024, respectively.
Meanwhile, volume profile data in Visser’s chart showed high trading volume around $0.73–$0.74, which he identified as strong support. Above the current price, volume is thinner, indicating fewer historical trades and potentially less resistance if upward momentum continues.
ADA Price Target — is $3.9 Imminent?
Visser indicated a potential long-term price target of $3.91 if the breakout holds. This would represent a gain of more than 350% from the price at the time of his recording. Notably, ADA’s all-time high remains $3.1, recorded in September 2021.
He said the projection is based on historical price behavior and the scale of the multi-year consolidation pattern. However, he did not specify a timeline for reaching the target.
Interestingly, Dan Gambardello had forecasted a sharp ADA rally to $3 byJanuary 25, drawing his outlook on the token’s historic surge from Q4 2020 to Q1 2021, but this failed to materialize. Similarly, pseudonymous analyst Madmaudo declaredthat ADA’s price at $3 is long overdue for Cardano. Meanwhile, analyst Mintern expects a short-term rise to $2.
DisClamier:
This content is informational and should not be considered financial advice. The views expressed in this article may include the author's personal opinions and do not reflect @Lachakari_Crypto opinion. Readers are encouraged to do thorough research before making any investment decisions. @Lachakari_Crypto is not responsible for any financial losses.