$BTC #
#### General Trend
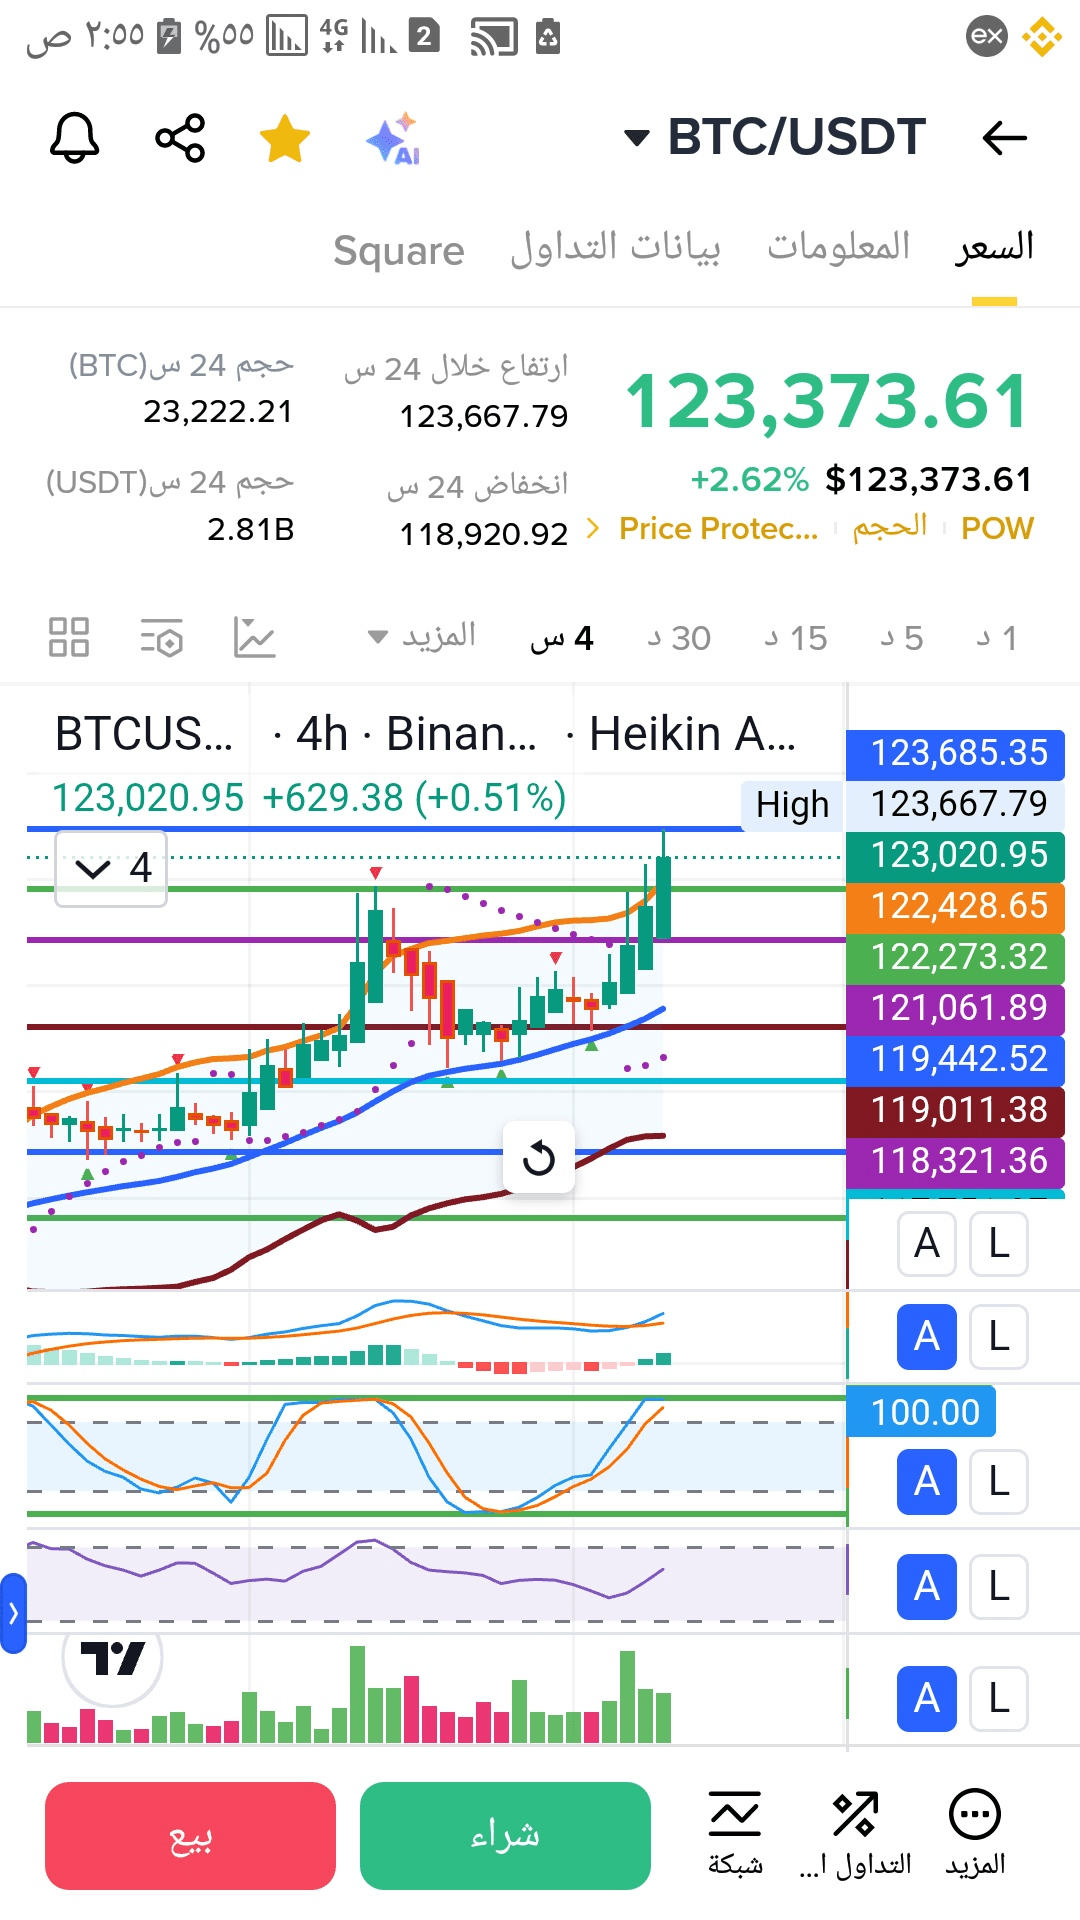
- Trend: Short-term bullish
After the correction we witnessed around the level of 112,000, Bitcoin has rebounded strongly and exceeded the level of 123,500 in the last session. A higher low has formed on the chart, indicating the continuation of the bullish momentum.
#### Key Support and Resistance
- Immediate Support:
- 113,769 - 110,828
This area represents the Fibonacci correction level of 38.2% to 61.8%, and strong support was found there twice during the past week, making it an important demand area.
- Secondary Support:
- 118,000 - 119,000
Previous support areas have turned into dynamic support and have been maintained during short corrections.
- Near Resistance:
- 123,650
The price peak in the last session, which is a psychological and technical resistance level. Breaking it may open the way towards 125,000.
- Next Resistance (Long-term):
- 130,000
A potential target according to Fibonacci analysis and the upward channel movement. It has been indicated as a potential target in the coming weeks.
#### Supporting Market Factors
- Positive News:
- A British company issued Bitcoin-denominated bonds worth $21 million, reinforcing the idea of Bitcoin's adoption as an investment asset in traditional finance.
- Continuation of institutional investment flow, such as TOBAM's full subscription to the bonds.
- Mining Activity:
- Bitdeer added 42.2 BTC to its holdings in August, indicating confidence from major players in the future price, and a decrease in selling volume compared to production.
#### Summary in Points
- The bullish trend remains intact on the 4-hour chart.
- The price respects the Fibonacci support at 38.2% – 61.8% at 110,828 – 113,769.
- Exceeding 123,650 may lead to testing 125,000 then 130,000.
- Selling pressure is weak, and institutional momentum supports the continuation of the rise.
😎👍❤
