📊 How $680 can become $40,000 - Master charting plan
Many traders believe you need a large capital to achieve life-changing gains.
The truth? Even $680 can evolve into over $40,000 if you master one valuable skill: spotting chart patterns and trading on them.
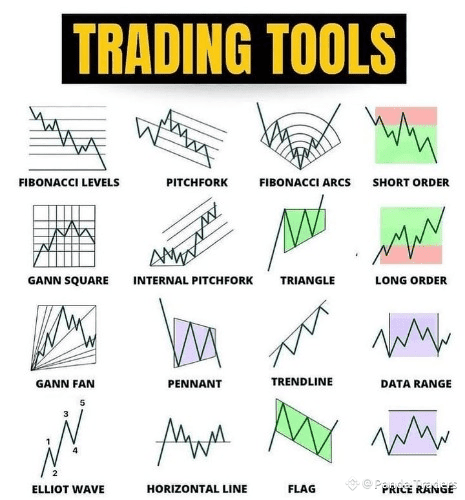
These patterns are fingerprints of market psychology - revealing when to buy, when to sell, and when to sit quietly.
🔍 The four main pattern groups
1️⃣ Continuation upward - the market takes a breather, then rises
(ascending triangle, ascending wedge, bullish flag, ascending symmetrical triangle)
2️⃣ Continuation of the downtrend - price pauses before another drop
(descending triangle, descending wedge, bearish flag, descending symmetrical triangle)
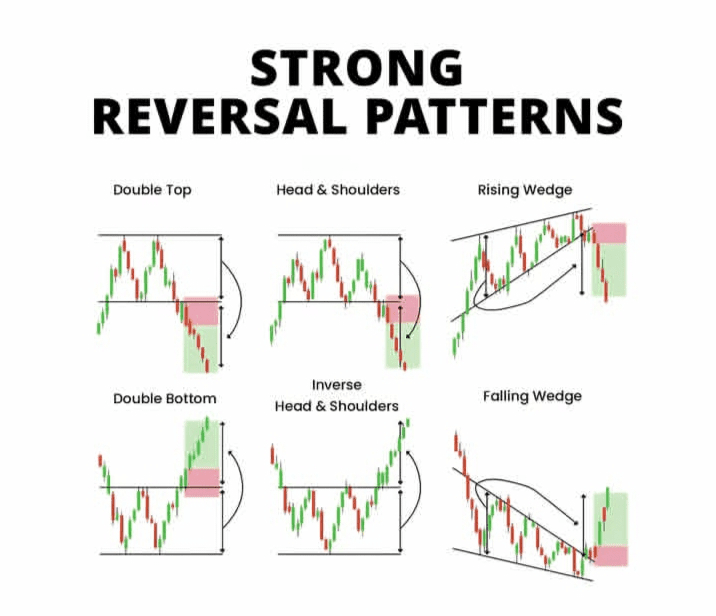
3️⃣ Bullish reversal - a downtrend indicates a potential comeback
(double bottom, triple bottom, inverted head and shoulders, descending wedge)
4️⃣ Bearish reversal - an uptrend shows signs of decline
(double top, triple top, head and shoulders, ascending wedge)
💡 From $680 to $40,000 - the plan
Risk 2-3% per trade ($14-$20)
Use leverage ranging from 3 to 5 times only for high-confidence setups
Buy at confirmed breakouts, and set stop loss just outside the pattern
Take profits using the "measured move" rule
📈 Small wins → Big results
Consistent gains can increase by 3-5% per trade:
$680 → $720 (trade 1)
~$1,050 (trade 15)
~$5,400 (trade 50)
Over $40,000 (trade 100+)
⚠️ Risk first, profit second
✔ Always set a stop loss
✔ Don't chase failed trades
✔ Trade with the market trend, not against it
Pro tip: Test the old chart before risking real money. Combine pattern recognition with the Relative Strength Index (RSI), Moving Average Convergence Divergence (MACD), and trading volume for higher accuracy. This skill alone can set you apart from most traders.
#TradingTips 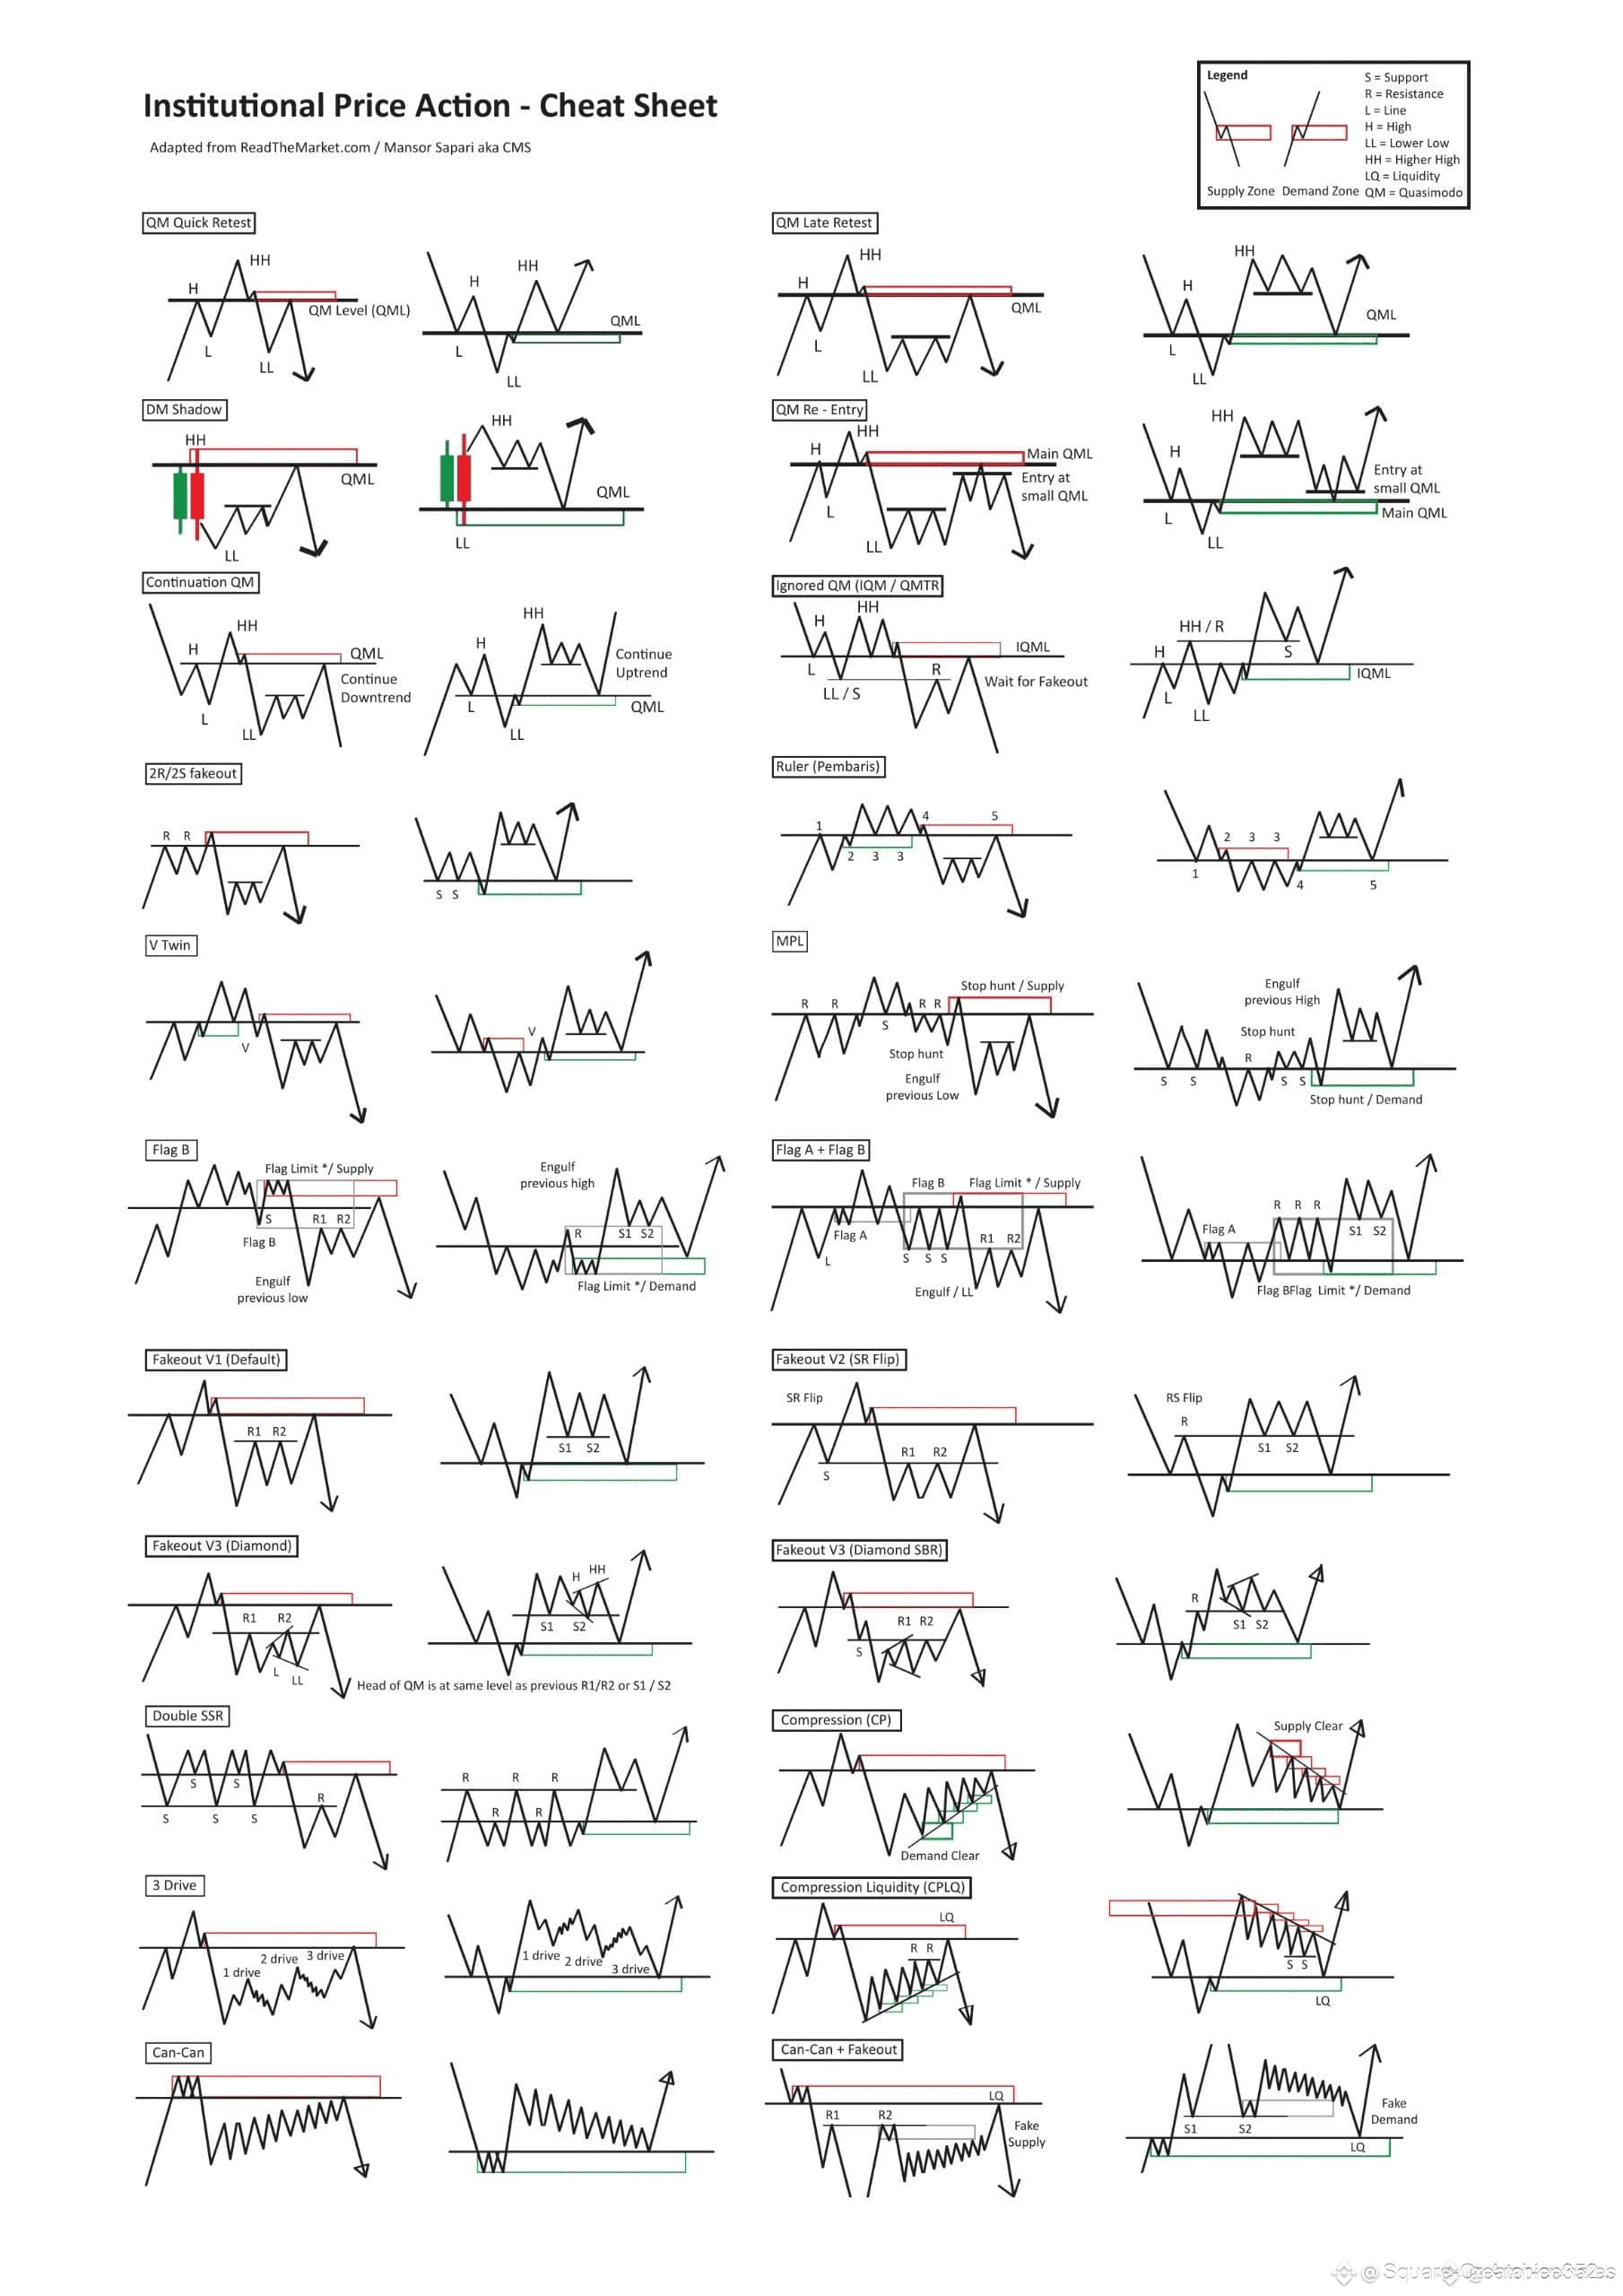
 #ChartPatterns #CryptoStrategy #BitcoinTrading #BinanceSquare
