⏳ “A chart is like the market’s diary — if you know how to read it, you know what traders are thinking.”
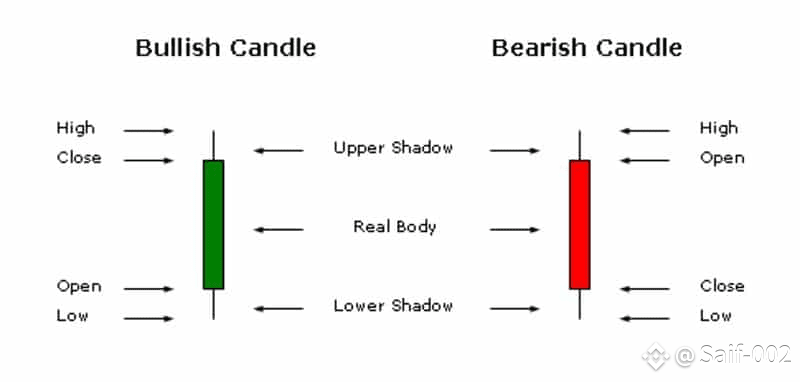
🕯 Candlestick Basics:
Each candle shows 4 things — •opening price, •highest price, •lowest price, and •closing price for that time frame.
🟢Green candle = buyers won that period.
🔴Red candle = sellers were in control.
📊Long wicks = strong rejection, meaning price tried to move but was pushed back.
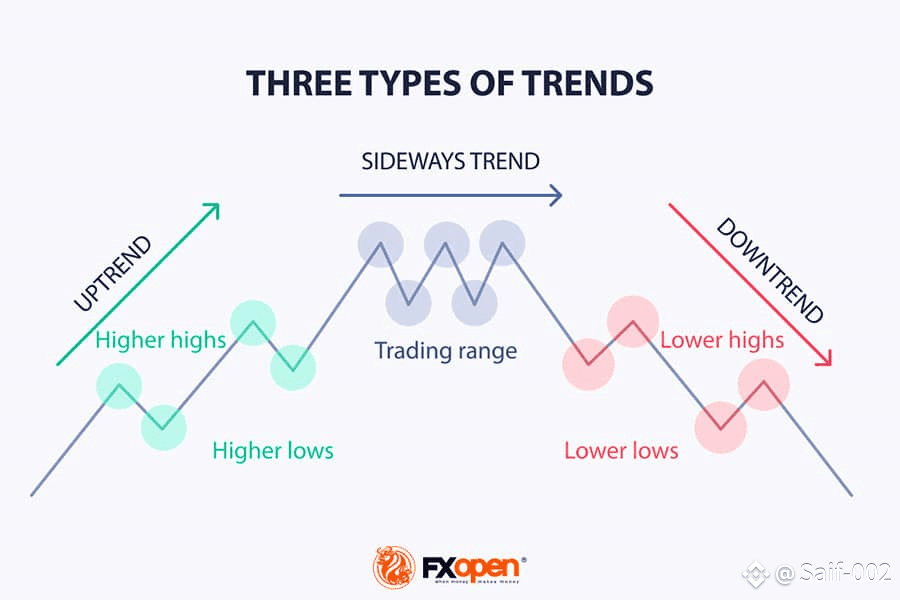
📉 Identify the Trend:
Higher highs + higher lows = uptrend (bullish).
Lower highs + lower lows = downtrend (bearish).
Sideways movement = consolidation — market taking a break.
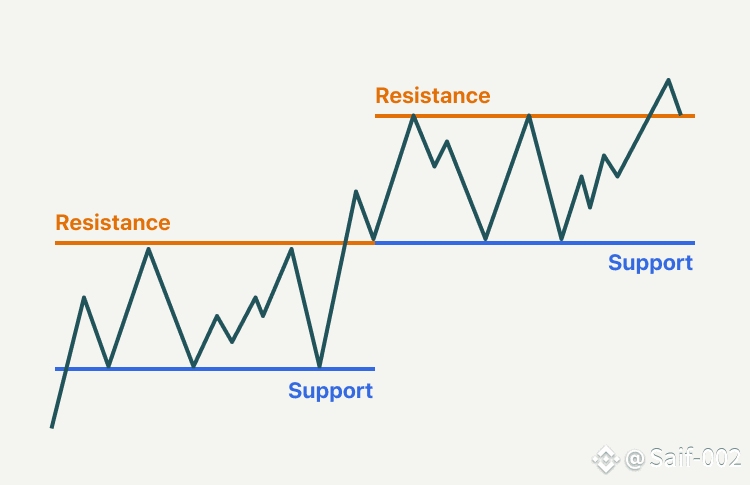
🧱 Support & Resistance Levels:
Support is like the “floor” — price often bounces up from it.
Resistance is like the “ceiling” — price often bounces down from it.
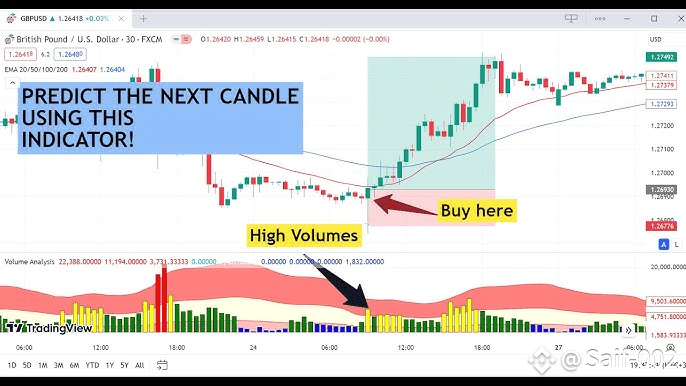
📏 Check the Volume:
High volume = strong move (big players involved).
Low volume = weak move (less commitment).
💡Quick Tip:
🔍 Before entering a trade, always do a quick check: Trend → Key Levels → Volume → Entry Trigger.
🌐Conclusion:
You don’t need 10 indicators to trade well — just learn to read the story the chart is telling you.
💬 Do you keep your charts clean or load them with tools?
Now so far what have you learnt about crypto apply on this strong signal👇🏻👇🏻
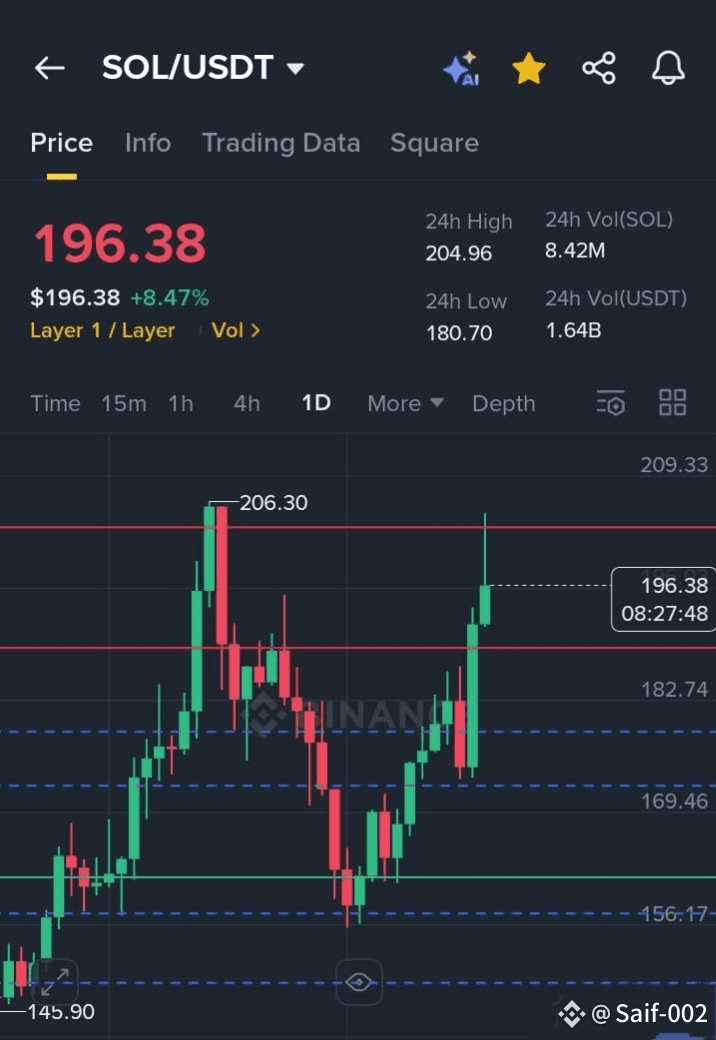
🔥 $SOL /USDT — $196.38, breakout momentum 🚀
Entry: $196 – $199
Stop Loss: $188
Targets: $202 / $206 / $213
📊 Above $194 = bullish, below $188 = slowdown.
#CryptoCharts #TechnicalAnalysis #tradingtips #CryptoEducation💡🚀 #SOLUSDT