"Bitcoin Eyes $122K Breakout as Bulls Defend Key Fibonacci Support"**
Looking at your BTC/USDT 4-hour chart:
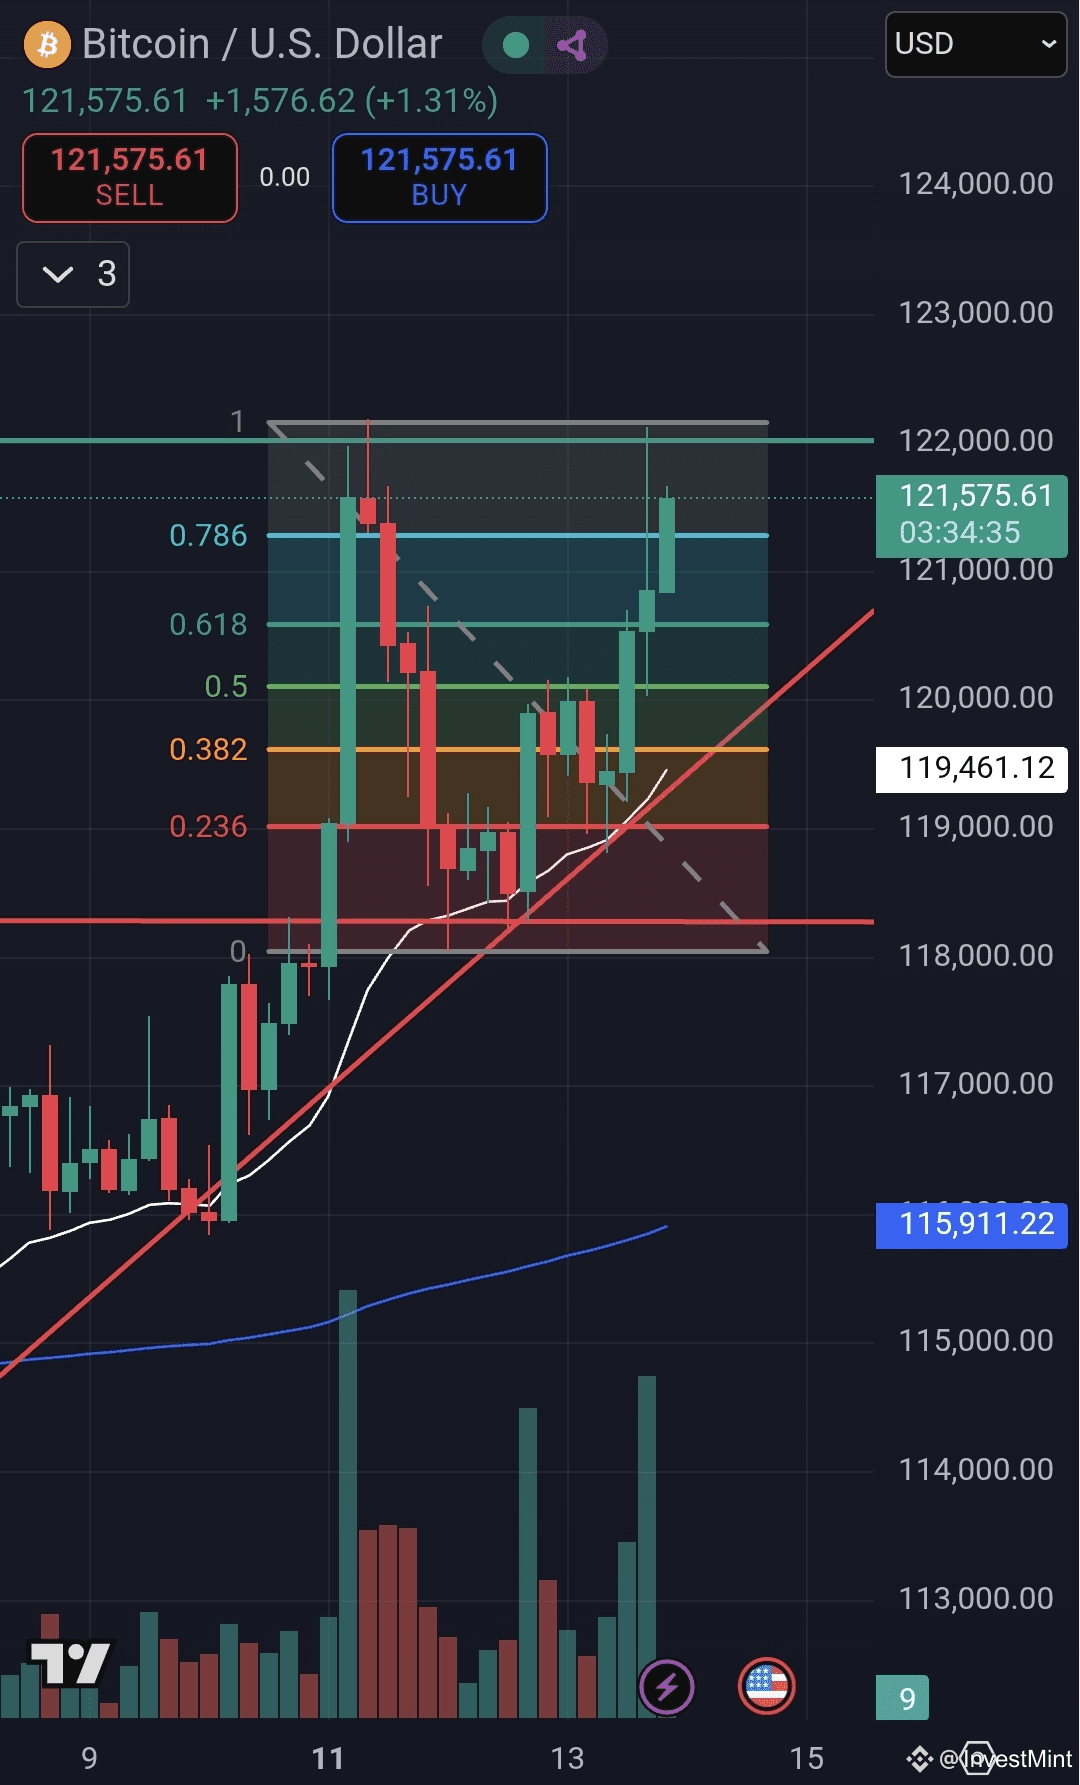
**1. Trend & Structure**
* Price is in an **uptrend** after breaking above the descending resistance seen earlier in August.
* There’s a **higher high & higher low** pattern forming, supported by the red ascending trendline.
* The **50 EMA** (white) is above the 200 EMA (blue), signaling short-term bullish momentum.
**2. Fibonacci Levels**
* Recent retracement respected the **0.382–0.5 zone** (around $119,800–$120,200) as support.
* Price is now testing above the *0.786 Fibonacci retracement** ($121,150).
* A breakout and close above $121,200 could push toward $122,000–$122,500** next.
**3. Support Zones**
* **Immediate support:** $120,200 (trendline + Fib 0.5)
* **Stronger support:** $119,400 (Fib 0.236)
* **Major support:** $118,000 (horizontal red line + previous swing low)
**4. Resistance Levels**
* **Immediate resistance:** $121,200–$121,300
* **Major resistance:** $122,000–$122,500
* Above that, potential upside toward $123,000+
**5. Volume**
* Increasing green volume bars suggest buyers are stepping in on pullbacks.
**6. Trade Bias**
* **Bullish scenario:** Hold above $120,200 → possible breakout above $121,300 → target \$122,500.
* **Bearish scenario:** Break below $119,400 → retest $118,000 → risk of deeper correction toward $116,000.