

📊 Analysis of ERA/USDT (4H)
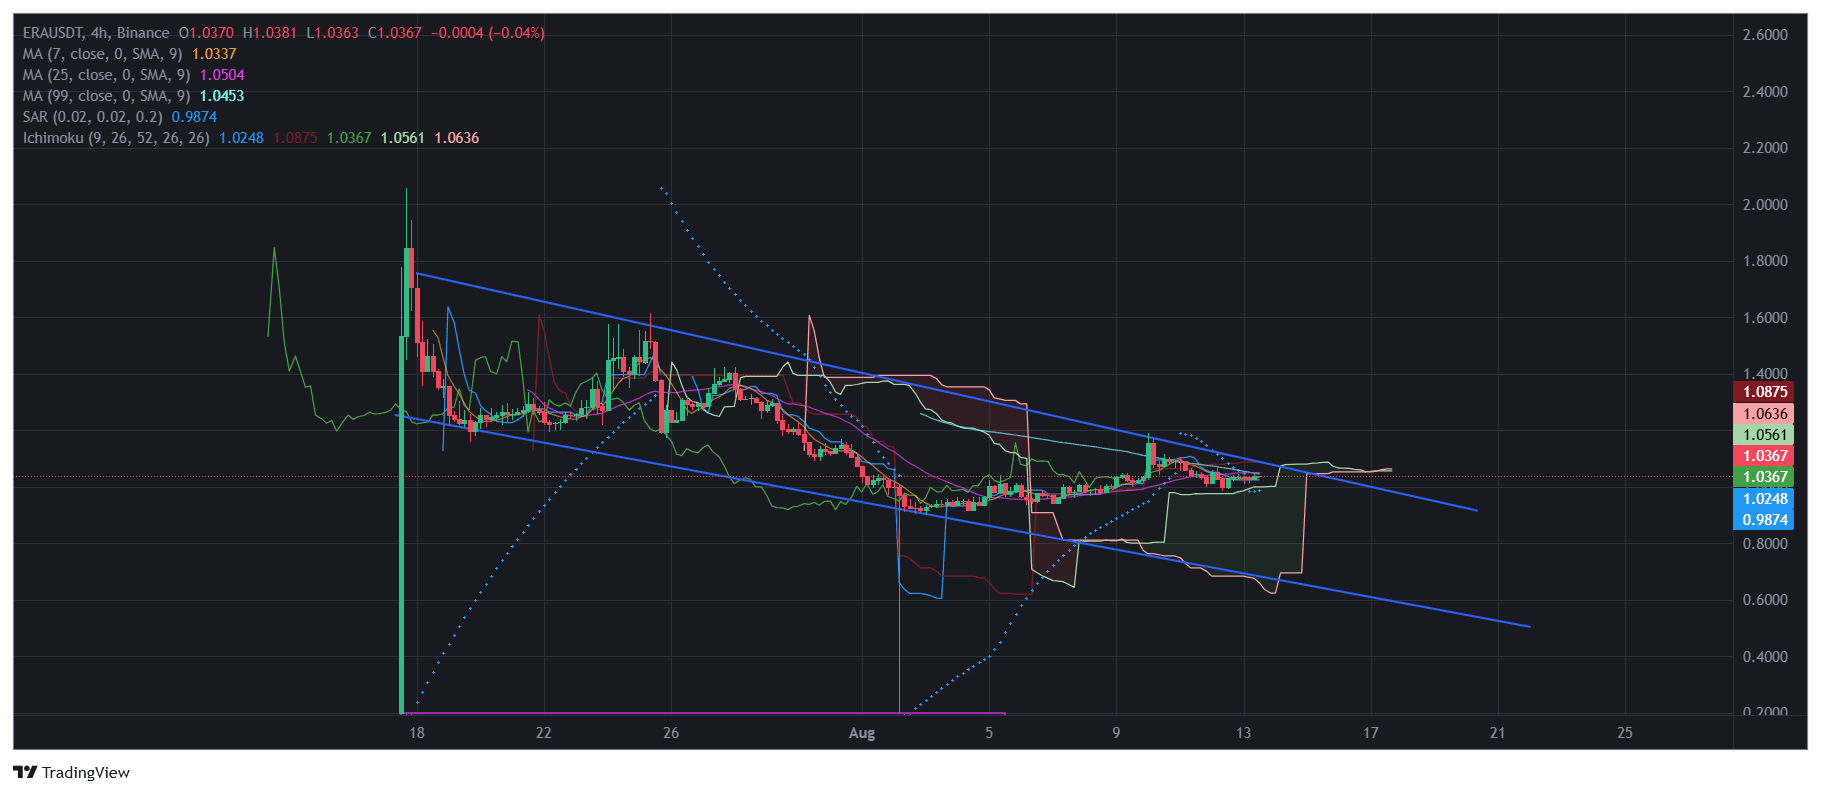
On the ERA asset chart, a descending channel is forming 📉, within which the price continues to move, testing the upper boundary of the trendline. The current quote is $1.0367 💵.
Indicators:
MA(7) $1.0337 and MA(25) $1.0504 are close to each other, indicating a phase of uncertainty ⚖️.
Ichimoku — the price is near the cloud, a breakout upward may signal the beginning of a bullish impulse 🐂.
Parabolic SAR — the points are located below the price, indicating short-term support for the upward movement 📈.
Key levels: Support: $1.0248 🛡 and $0.9874.
Resistance: $1.0561 and $1.0875 🚀.
📌 Conclusion: the market is tightening before a potential breakout. If the price consolidates above $1.0561, a breakout from the descending channel and a rise to $1.09–$1.14 is possible. A breakout downward below $1.0248 will increase bear pressure 🐻.
@Caldera Official #Caldera $ERA
Caldera — the internet of rollups 🌐⚡
Caldera (ERA) is an ecosystem of modular, interconnected, and customizable chains 🔗. The project creates an 'internet of rollups', where each chain is optimized for specific tasks — from DeFi to gaming 🎮💰. This architecture ensures scalability 🚀, flexibility, and easy integration. Caldera paves the way to Web3, where networks communicate quickly and securely 🔒✨.

