
In a new post on X, analyst Ali Martinez mentioned a multi-year technical analysis (TA) pattern on the weekly price chart of XRP. The pattern mentioned is a triangle, which forms whenever an asset trades between two converging trend lines.
The upper line of the pattern is likely to create a resistance level, while the lower line creates a support level. Breaking through either of these levels could signal the continuation of the trend in that direction; a bullish breakout above the triangle could be a bullish signal, while a bearish breakout below this pattern could be a bearish signal.
Triangles can come in a few types, with three common forms being ascending, descending, and symmetrical. The direction of the trend lines determines which specific type of triangle the channel belongs to.
A trend line parallel to the time axis means the pattern belongs to one of the first two types. More specifically, it is an ascending triangle pattern if the upper line is parallel, while it is a descending triangle pattern if the lower line is flat.
When both trend lines converge at a nearly equal angle and in opposite directions, a symmetrical triangle will form. In the context of the current topic, the triangle of interest is closest to this type.
Below is the chart shared by Martinez, showing the long-term triangle within which XRP's price has traded for 7 days before the previous breakout.
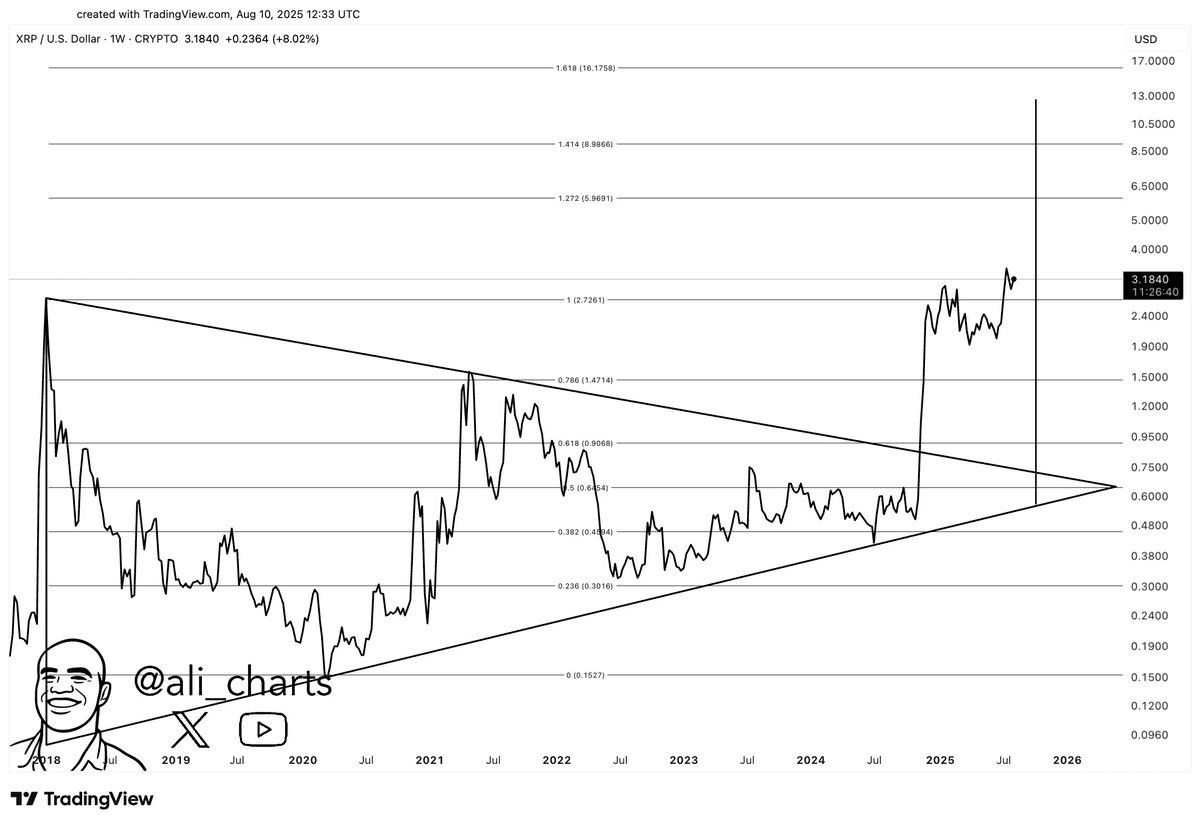
As can be seen in the chart, XRP's weekly price has traded within a pattern resembling a symmetrical triangle with a slight upward trend from 2018 to 2024. In a true symmetrical triangle, the probability of a breakout is considered equal in both directions, but given that this triangle is upward-facing, the likelihood of a bullish breakout may be higher.
And in fact, in November 2024, the asset broke through the upper boundary of the pattern, triggering a bullish rally. Overall, triangle breakouts are considered to have the same length as the height of the pattern. This means that the subsequent price movement could be approximately equal to the distance between the trend lines at their widest point.
In the chart, Martinez highlighted a potential target for XRP, based on this idea: $12.60. Considering the current value of this cryptocurrency, a rise to this level would imply an increase of nearly 287%. It remains unclear whether this pattern will hold the value of the token.