01
Cryptocurrency Technical Analysis Indicators Popularization
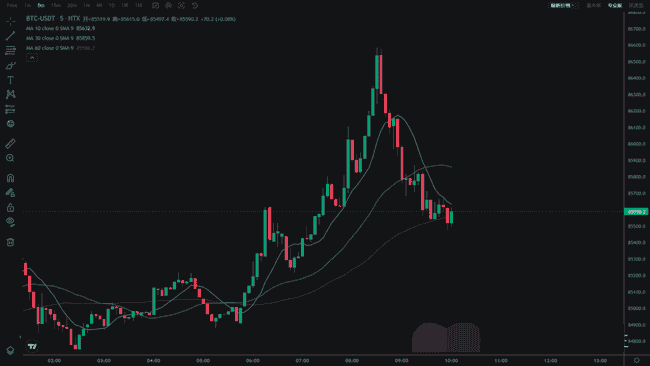
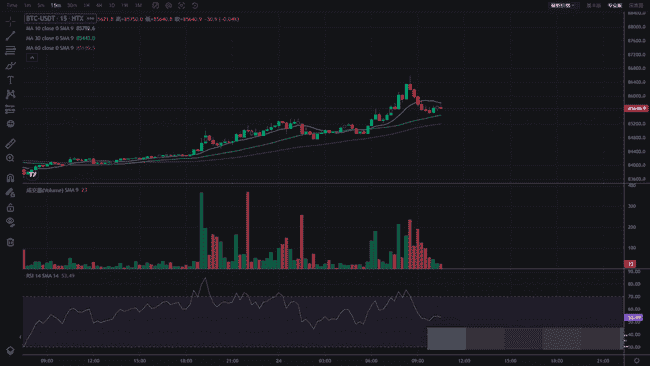
1. Moving Average (MA): A powerful tool for trend judgment
Definition: The Moving Average smooths data fluctuations by calculating the average price over a period of time, helping you determine the overall market trend.
Application Tips:
Golden Cross: The short-term moving average crossing above the long-term moving average is often seen as a buy signal.
Death Cross: The short-term moving average crossing below the long-term moving average may indicate a selling opportunity.
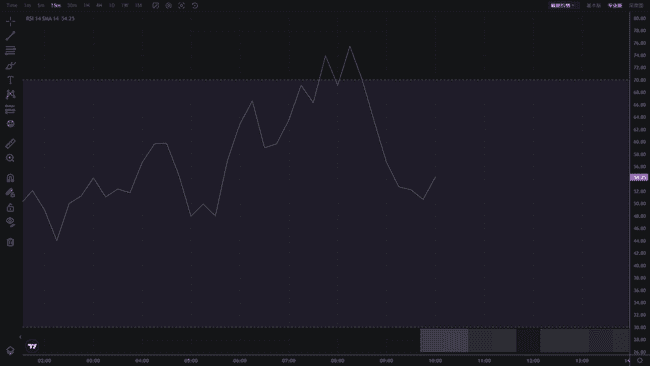
2. Relative Strength Index (RSI): Overbought and Oversold Signals
Definition: The RSI indicator measures the speed and magnitude of price changes, with values ranging from 0 to 100.
Application Tips:
When RSI exceeds 70, it usually indicates that the market is overbought, increasing risk.
If RSI is below 30, it may indicate an oversold area, presenting a buying opportunity.
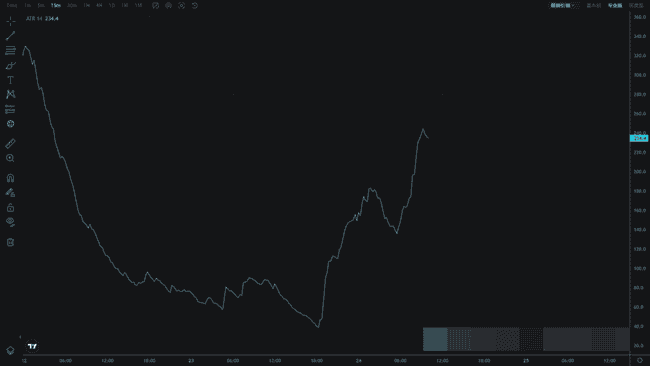
3. Average True Range (ATR): Volatility Indicator
Definition: ATR measures market volatility; a higher value indicates more intense fluctuations.
Application Tips:
It can help you set reasonable stop-loss positions, for example, setting the stop-loss at 1.5 times the current ATR to reduce risk.
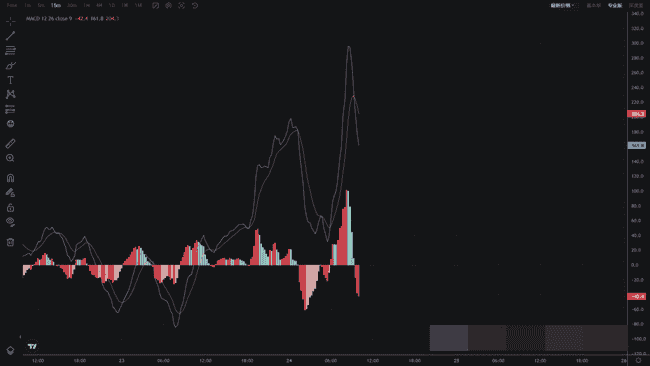
4. MACD Indicator: Double Validation of Momentum and Trend
Definition: MACD generates momentum signals by utilizing the difference between two Exponential Moving Averages (EMA).
Application Tips:
Cross Signal: When the MACD line crosses above the signal line, it is a buy signal; conversely, it is a sell signal.
Histogram Changes: The expansion or contraction of the histogram helps assess the strength of the trend.
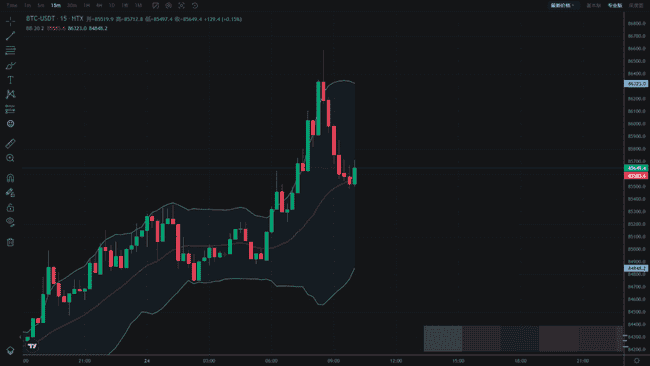
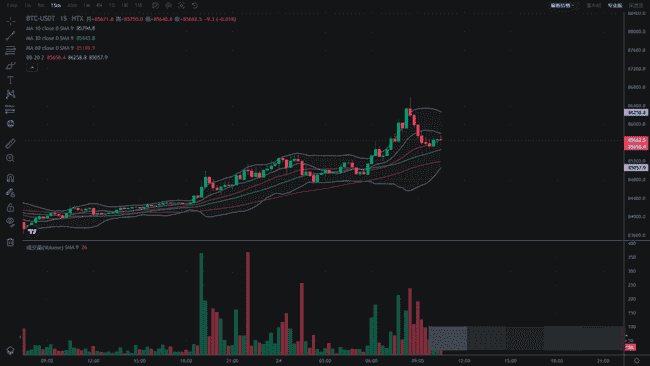
5. Bollinger Bands: Price Volatility Range
Definition: Bollinger Bands consist of a middle band (usually a 20-day SMA) and two standard deviation lines above and below.
Application Tips:
When the price touches the upper band, it may indicate overbought conditions, while the lower band may indicate oversold conditions.
A narrowing of the Bollinger Bands signals that a significant market move is imminent, requiring close attention.
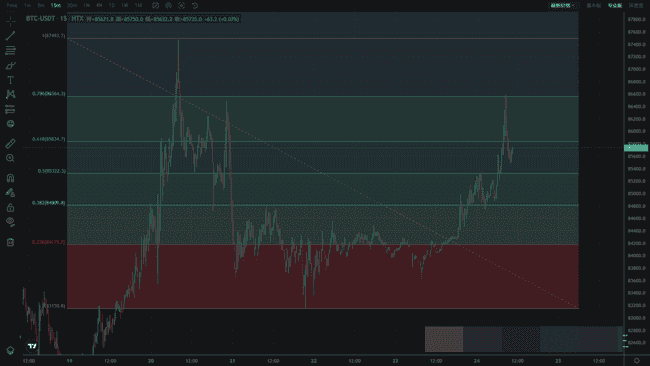
6. Fibonacci Retracement: Finding Support and Resistance
Definition: Based on the golden ratio (such as 0.382, 0.5, 0.618, etc.), determine the support and resistance levels for price retracements.
Application Tips:
In an uptrend, a retracement to the 0.618 range may provide a buying opportunity.
In a downtrend, a rebound to the 0.382 range may form a selling signal.
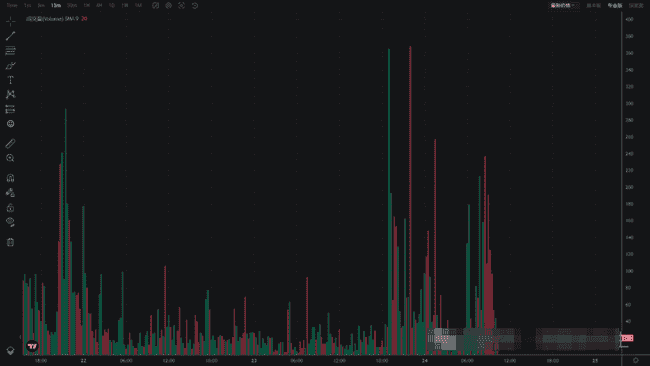
7. Volume Indicator: A Key to Validate Trends
Definition: Trading volume reflects market activity and is typically analyzed alongside price movements.
Application Tips:
The trend is more reliable if the trading volume increases when the price rises.
If the price rises but trading volume shrinks, caution is needed as the trend may reverse.
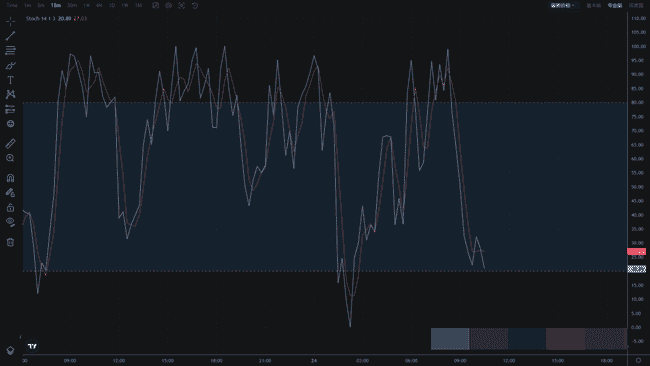
8. KD Indicator: Capturing Short-term Trading Opportunities
Definition: The KD Indicator uses the Stochastic Oscillator to assess price momentum.
Application Tips:
K line crossing above D line: Often a buy signal.
K line crossing below D line: May suggest a sell signal, suitable for short-term trades.
02
Practical Tips: Indicator combinations help you establish a foothold in the cryptocurrency market.
Single indicators often have limitations, and it is advisable to combine multiple indicators in actual trading.
MA and RSI Combination: When the short-term moving average crosses above the long-term moving average and the RSI is not yet overbought, consider entering the market in the direction of the trend.
MACD and Bollinger Bands: MACD cross signals combined with the narrowing of Bollinger Bands can help you capture entry opportunities before a market explosion.
Volume Validation: Regardless of which indicator is used, trading volume remains an important basis for assessing market sustainability, and must be observed in conjunction.
