Bitcoin recently faced strong rejection just below the historical peak of $123,218, indicating that bears are not ready to concede. BTC's failure to set a new record has triggered a wave of corrections in many altcoins, although some have quickly bounced back.
After the rejection on Monday, many analysts have begun to express caution. ZAYK Charts' account on X stated that, according to the Wyckoff method, BTC may have entered a distribution phase. If this scenario materializes, the price could fall deeply to the $95,000 area.
In contrast to BTC's stagnation, Ether (ETH) continues to demonstrate strength. Data from Farside Investors shows that on Monday alone, ETH spot ETF funds attracted a net of $1.01 billion - a record high.
Can BTC unexpectedly break out again? Or will ETH become the spark that leads the rally of altcoins? Let's explore the price charts of 5 cryptocurrencies that are showing strong performance in the short term.
Technical analysis of BTC
Bears have successfully thwarted bulls' efforts to push BTC to a new historical high above $123,218 on Monday.
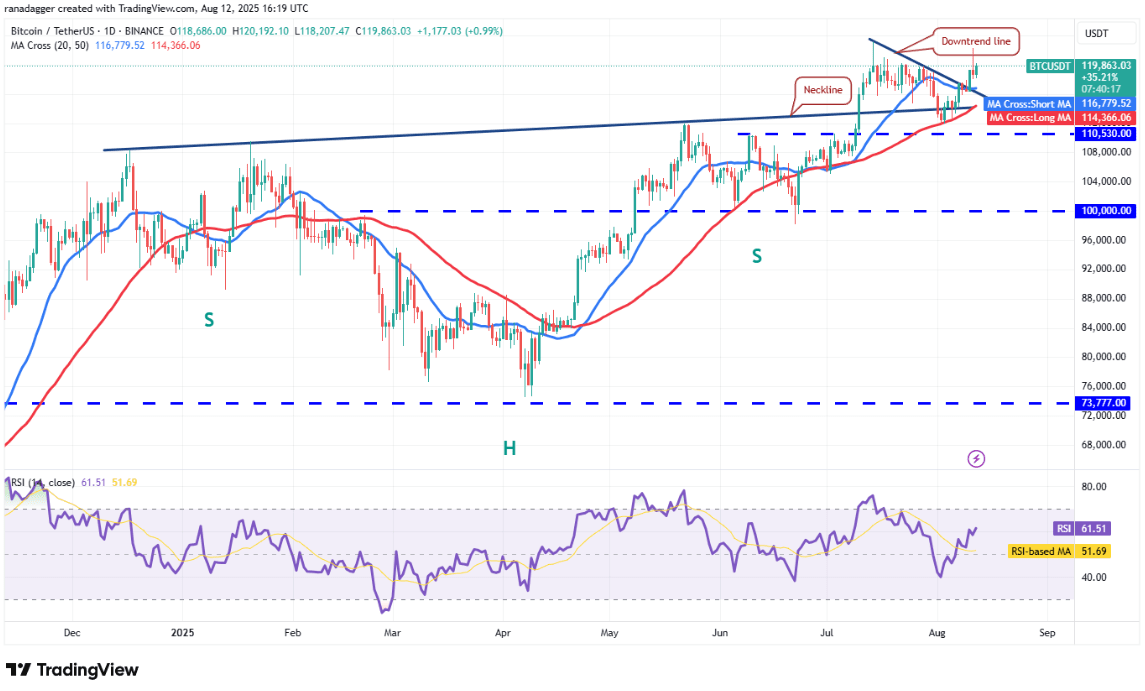
The 20-day simple moving average (SMA) is flat at $116,779, indicating a balance between supply and demand, but the relative strength index (RSI) in the positive zone shows that momentum is still leaning towards bulls. If the price holds above the 20-day SMA, bulls will continue to attempt to break the $123,218 threshold. If successful, BTC could soar to $135,000.
Conversely, if it falls below the 20-day SMA, this indicates profit-taking pressure from short-term traders, which could pull the price down to the 50-day SMA at $114,366, signaling a potential accumulation zone in the short term. Bears need to push the price below $110,530 to gain control.
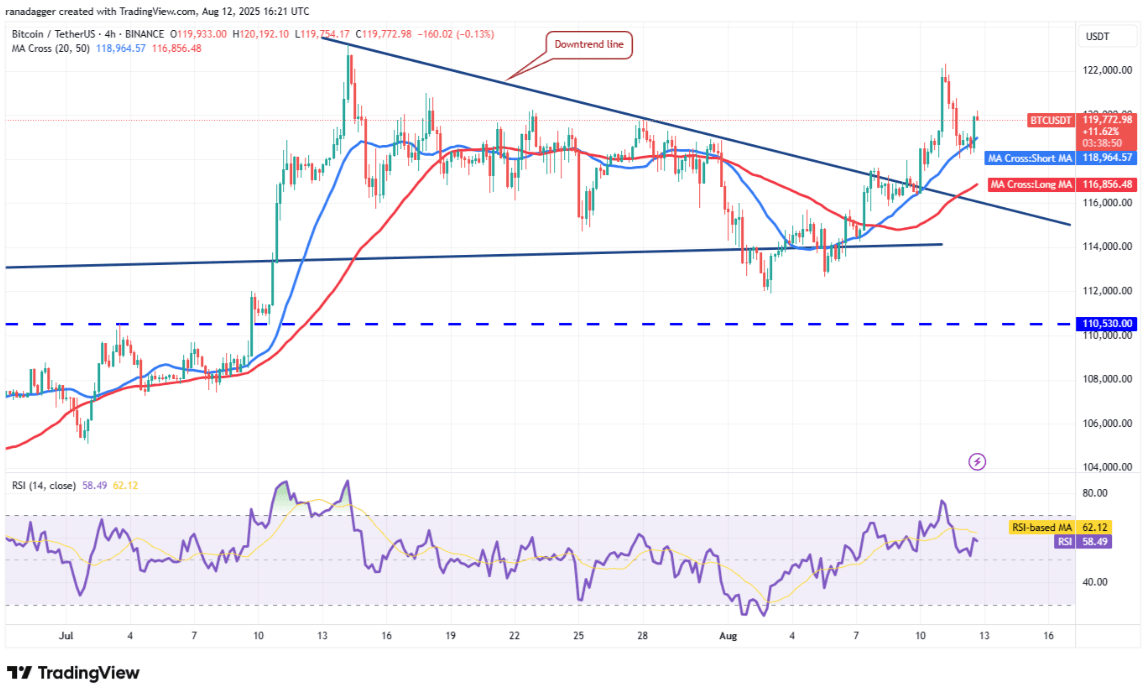
On the 4-hour chart, the price has bounced from the 20-period SMA. The moving averages are trending upward and the RSI is in the positive zone, indicating an advantage for bulls. If resistance at $123,218 is broken, the price could advance to $127,735 and then $135,000.
However, bears may have other plans: they will seek to pull the price below the downtrend line. If successful, BTC could fluctuate in the range of $123,218 - $111,920 for some time.
Technical analysis of ETH
ETH began a new bullish wave on Tuesday after breaking through the $4,366 threshold.
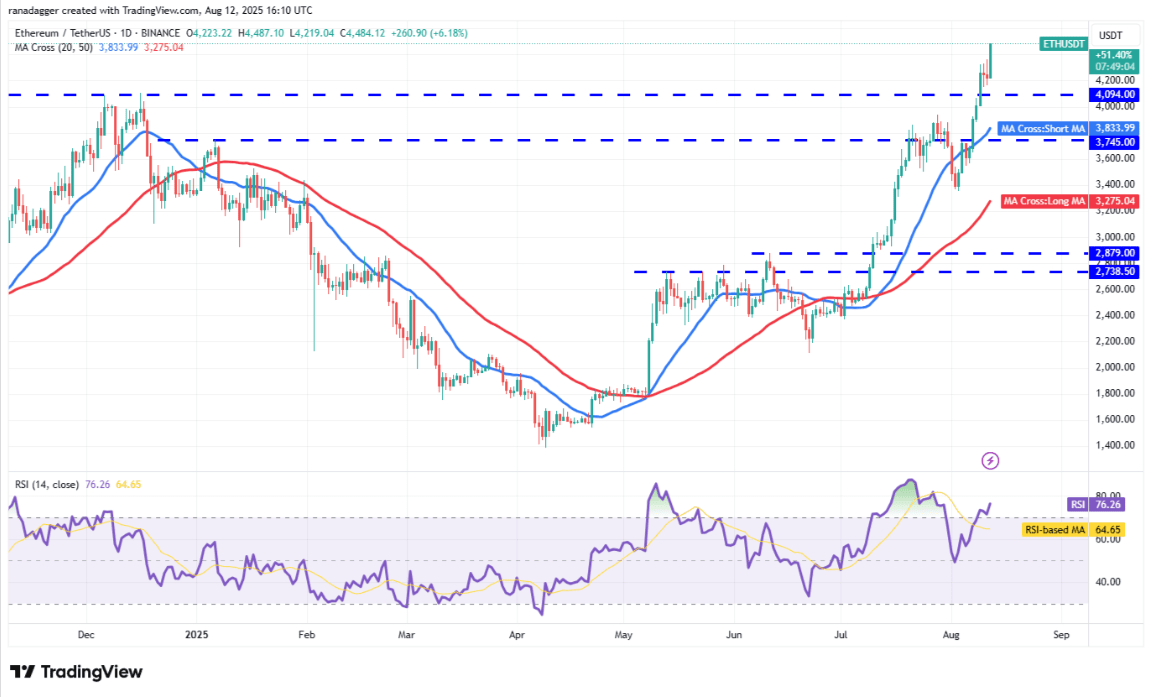
The moving averages are trending upward and the RSI is in the overbought zone, indicating that the prevailing trend remains bullish. Bulls will seek to consolidate their position by pushing the ETH/USDT pair up to $4,868.
The level of $4,094 is an important support to watch. If broken and closed below this level, it will indicate increased profit-taking pressure at high price levels, potentially pulling ETH back to the 20-day SMA at $3,833.
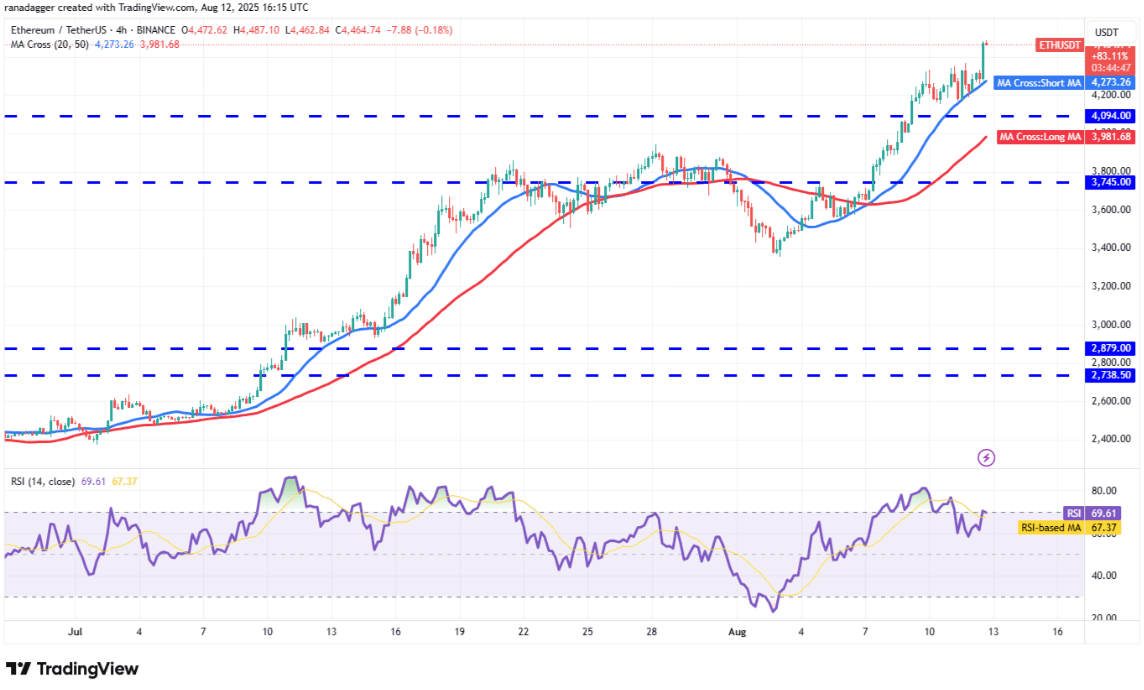
On the 4-hour chart, the correction from $4,366 has found support at the 20-period SMA, showing positive sentiment. ETH could rise to $4,500, followed by $4,868 - a zone where bears may exert strong pressure.
If the price closes below the 20-period SMA, ETH could drop to $4,094. A strong bounce from $4,094 would reinforce the support role of this area and increase the likelihood of a continuing uptrend. Conversely, if $4,094 is breached, a deeper correction may occur.
Technical analysis of BNB
BNB has been trading sideways in a narrow range of $792 - $827 for the past three days, reflecting a tug-of-war between bulls and bears.
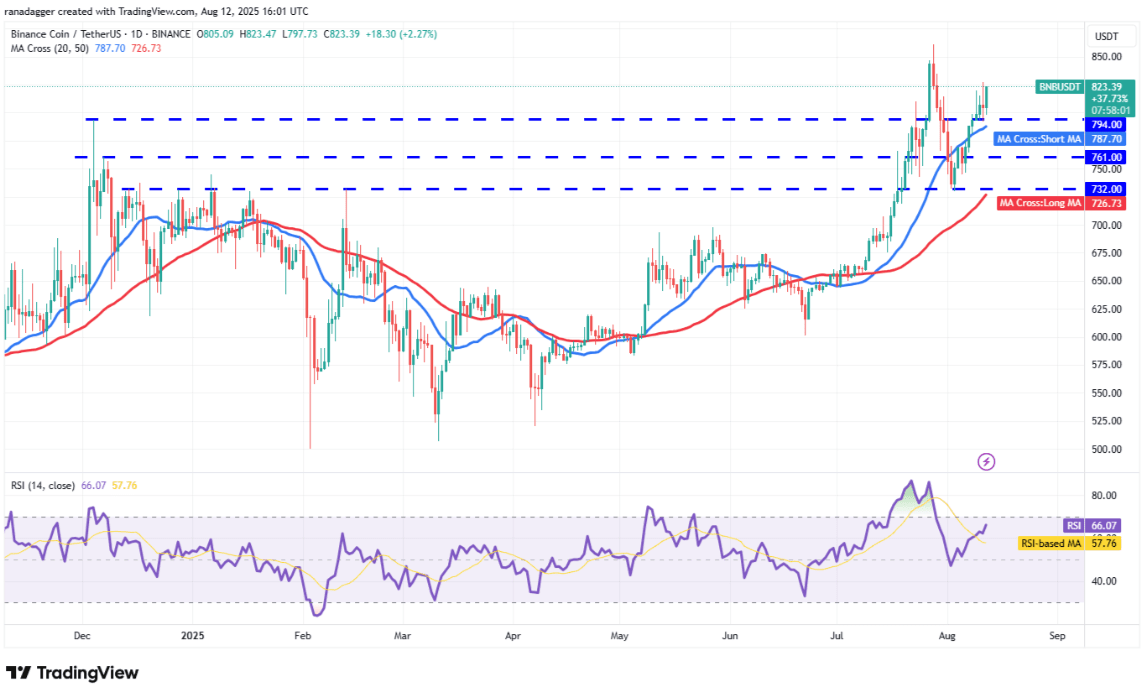
If the price breaks through $827, the BNB/USDT pair could rise to $861. This is a zone where bears are predicted to defend vigorously, but if bulls break through successfully, the price could head towards $900.
Bears need to pull the price below the 20-day SMA ($787) to activate a correction towards $761 and deeper to the strong support zone of $732. This is considered an important line of defense because if $732 is breached, the long-term uptrend could be threatened.
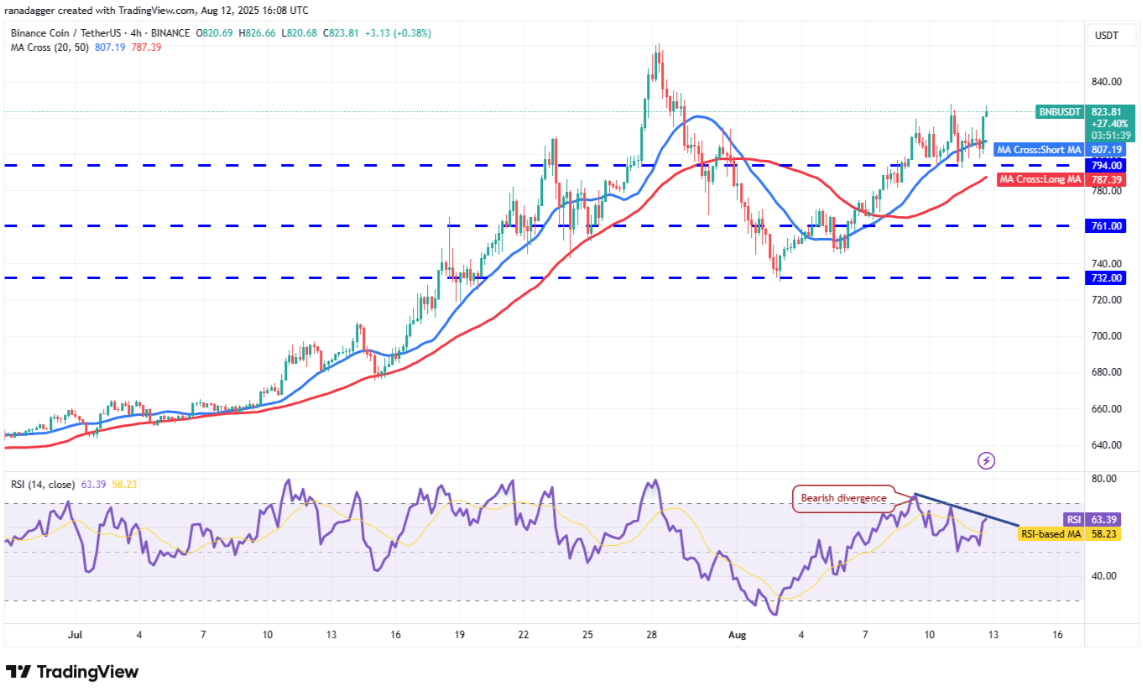
On the 4-hour chart, both moving averages are trending upward, but the RSI shows a bearish divergence signal, indicating a potential short-term weakness. Bears will dominate if the price drops below the 50-period SMA.
Conversely, if breaking out and closing above $827, the uptrend will be extended, with the next target being the resistance of $861 - where bears are likely to re-enter the fray.
Technical analysis of LINK
Chainlink (LINK) has accelerated strongly after breaking the important resistance of $18 on Thursday, showing fierce buying pressure from bulls.
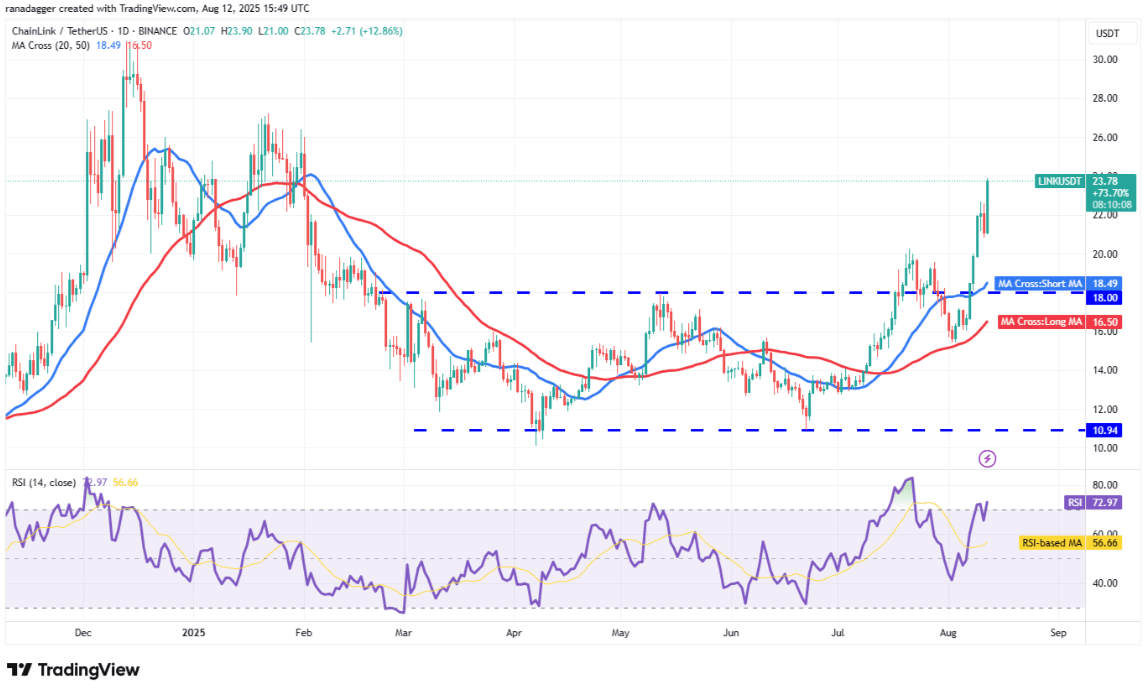
Bears attempted to halt the uptrend at the $22.70 mark, but bulls surpassed this threshold on Tuesday. The LINK/USDT pair is likely to continue climbing towards the $27 zone, where strong selling pressure from bears is anticipated. However, if buyers break through the $27 barrier, the uptrend could extend to $30.
This positive scenario will be negated in the short term if the price reverses sharply and falls below $20.83. At that point, the Chainlink price could retreat to $20, or even lower to the strong support zone of $18.
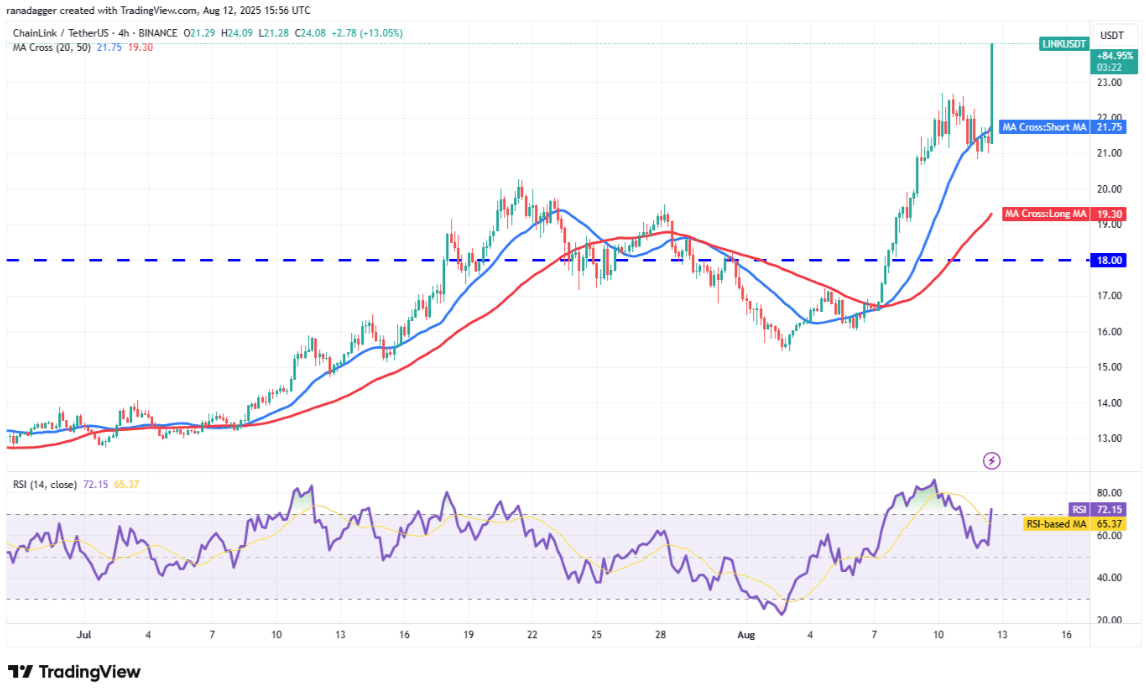
The recent correction has bounced back from the 20-period SMA on the 4-hour chart, indicating that investors continue to buy every time the price dips slightly. Both moving averages are trending upward and the RSI is in the overbought zone, reflecting that bulls still hold control.
The first support on the downside is at the breakout zone of $22.70, followed by $21. If the price breaks and closes below $21, it indicates that bulls are rushing to exit. The next downside target will be the 50-period SMA.
Technical analysis of UNI
Uniswap (UNI) has surged from the 50-day moving average (SMA) at $9.05 on August 3, indicating strong buying pressure at lower price levels.
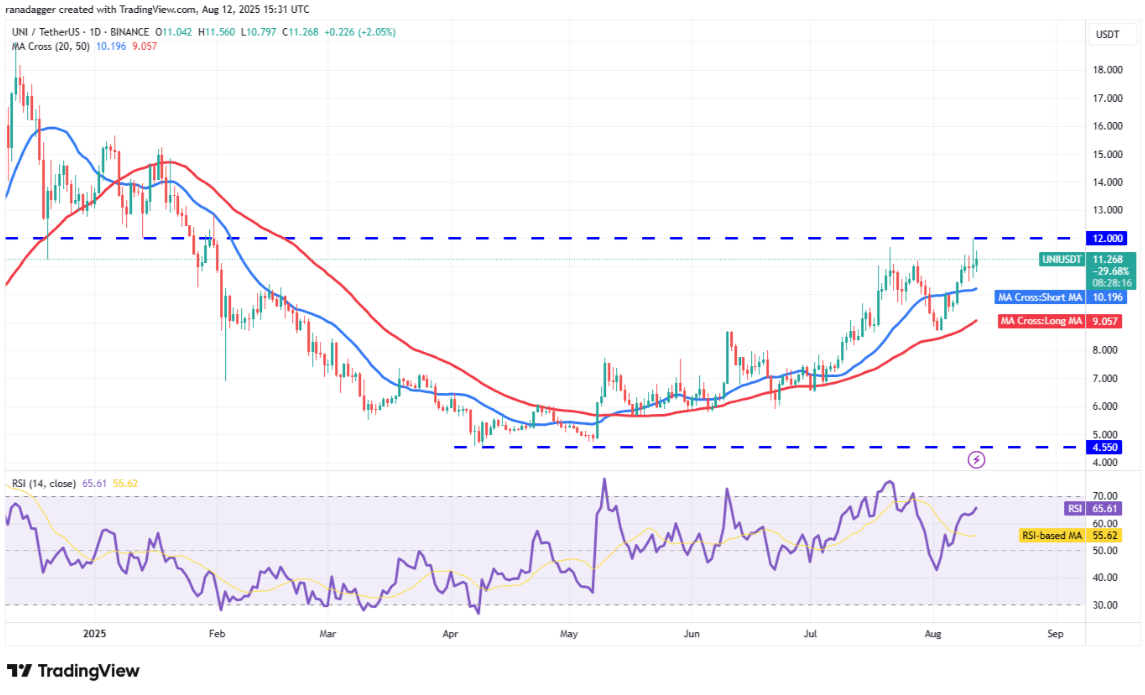
The current uptrend is facing selling pressure around $12, but the positive point is that bulls have not allowed bears to reclaim much ground. This indicates they expect the upward trend to continue. If buyers push the price above $12, the UNI/USDT pair could accelerate towards $15.
On the downside, the first support is the simple moving average (SMA) 20-day at $10.19. If this level breaks, the price of Uniswap could fall to the 50-day SMA. The short-term trend will reverse if bears pull the price below the 50-day SMA.
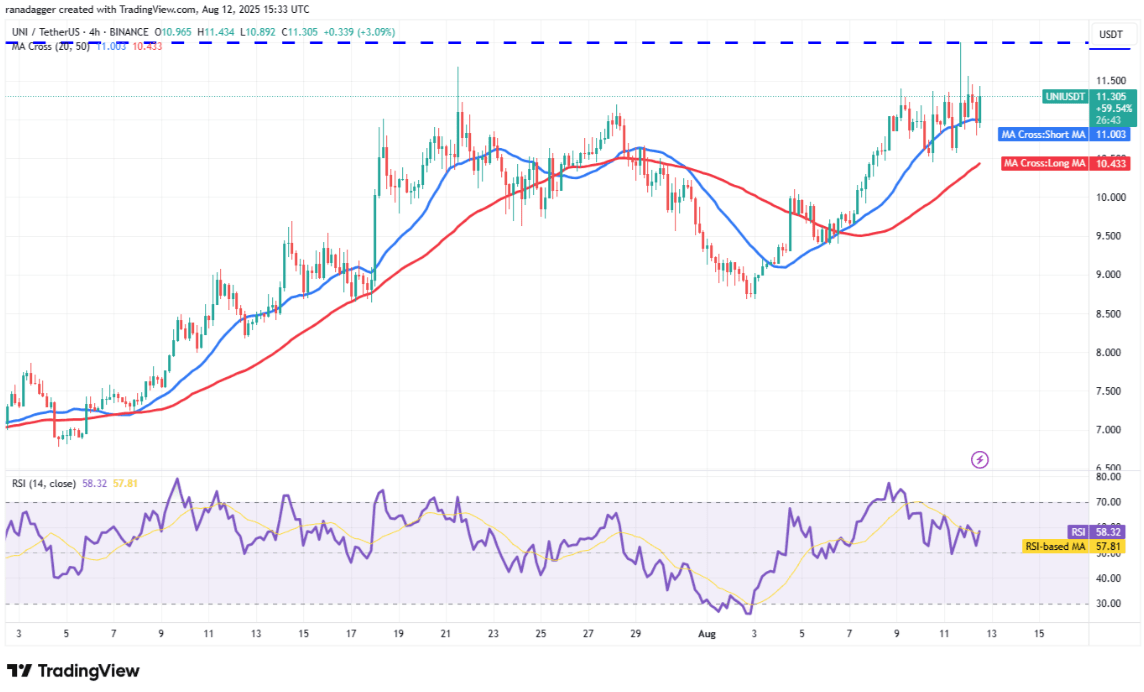
On the 4-hour chart, the currency pair has reversed from the resistance of $12, but the positive signal is that bulls are attempting to defend the SMA line. Buyers will again try to push the price above $12, and if successful, UNI could rise to $14 and then $15.
Conversely, bears will look to pull the Uniswap price below the 50-period SMA. If this scenario occurs, the price could drop to $10, then $9.50. This would create an accumulation zone in the range of $8.50 - $12 for a period.