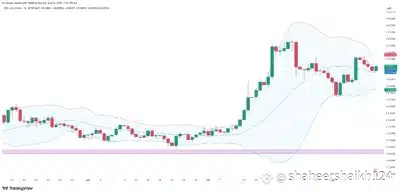
According to data from TradingView, XRP is trading near $3.18 on the daily chart, holding comfortably above the midband at $3.10. This level has historically marked the point where momentum either continues or loses strength.
A recent dip to $2.84 briefly touched the lower Bollinger Band before buyers stepped in to push the price back into the upper range. This move indicates sustained buying pressure, with the next resistance level at the upper band of $3.36 being closely monitored.
If the price closes above that point with strong volume, analysts expect a retest of the August high at $3.60. A successful move past that level could open the way to the $3.80 region in the near term.
Weekly Chart Remains Strong as Key Levels Hold
The weekly chart continues to show resilience, with XRP maintaining levels well above $3.28 This price acted as both resistance and support in previous cycles and has not been breached since the summer breakout.
Current market sentiment suggests that the range between $3.20 and $3.25 is the first support zone to watch. A deeper fallback would likely meet stronger support around $3.28
As long as these levels remain intact and volume increases during an upper band push, the potential for fresh highs remains on the table. Technical indicators still suggest that the ongoing rally has not exhausted its momentum.
Market participants are now focusing on the interaction between price and the upper Bollinger Band. A decisive breakout above $3.36 would confirm continued buying strength, potentially setting the stage for further gains before the end of the month.
XRP continues to trade within a favorable technical structure, supported by strong buying activity and a positive trend on both daily and weekly charts. While resistance levels ahead could slow the pace, the current setup keeps the possibility of new highs alive if market conditions remain in favor of buyers.