When you enter any trading platform, the first thing that grabs your attention is the chart (graph). At first, it looks intimidating, full of candles, colors, and lines, but believe me… once you understand it, you will see the market differently.
---
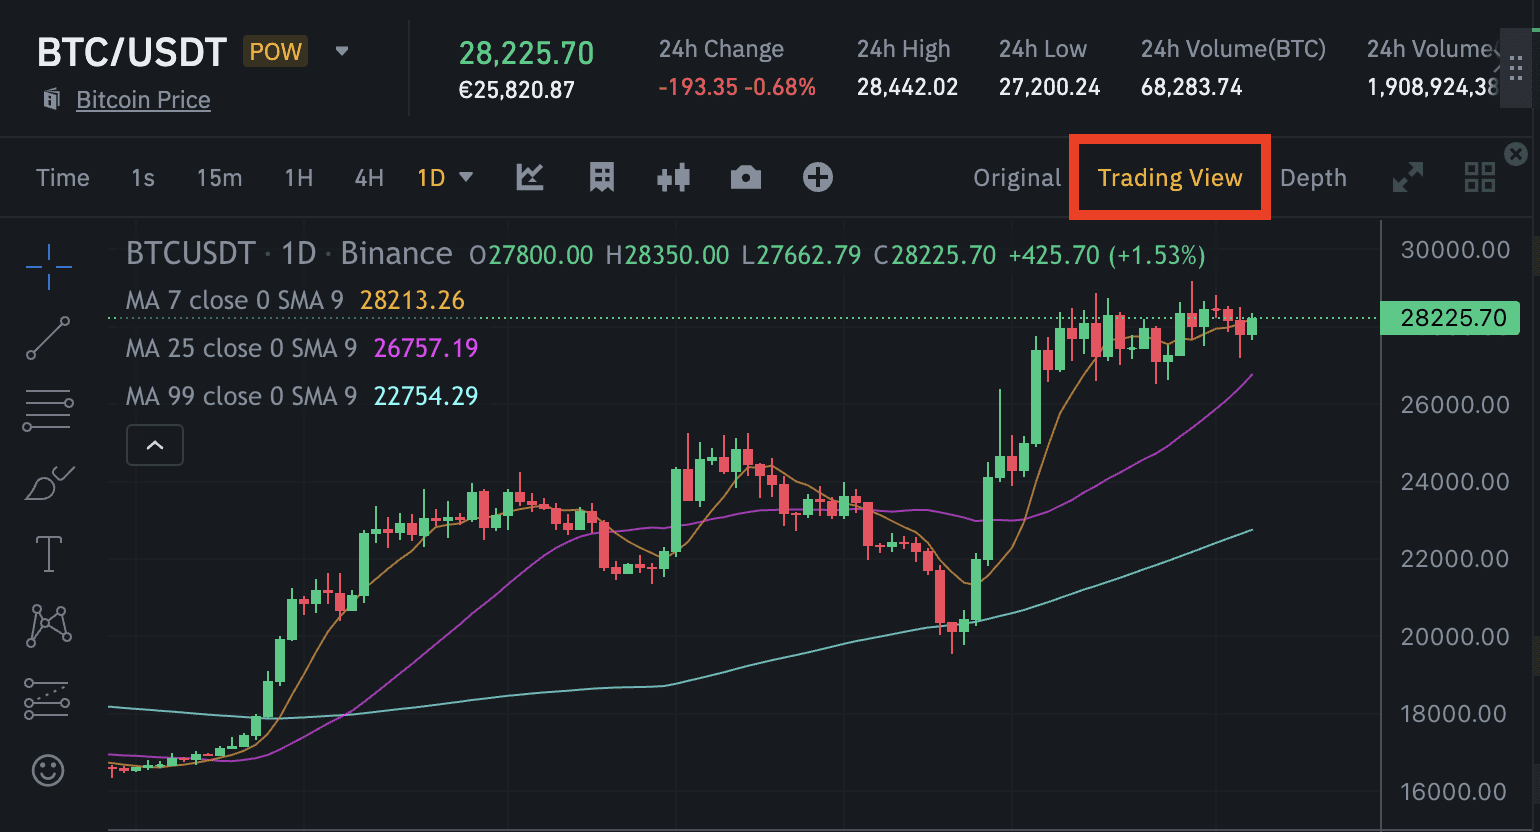
1️⃣ What is the chart anyway?
The chart is a price map, showing you how the currency price moved over time.
Each candle or bar represents a time period (minute, hour, day… depending on the frame you choose).
---
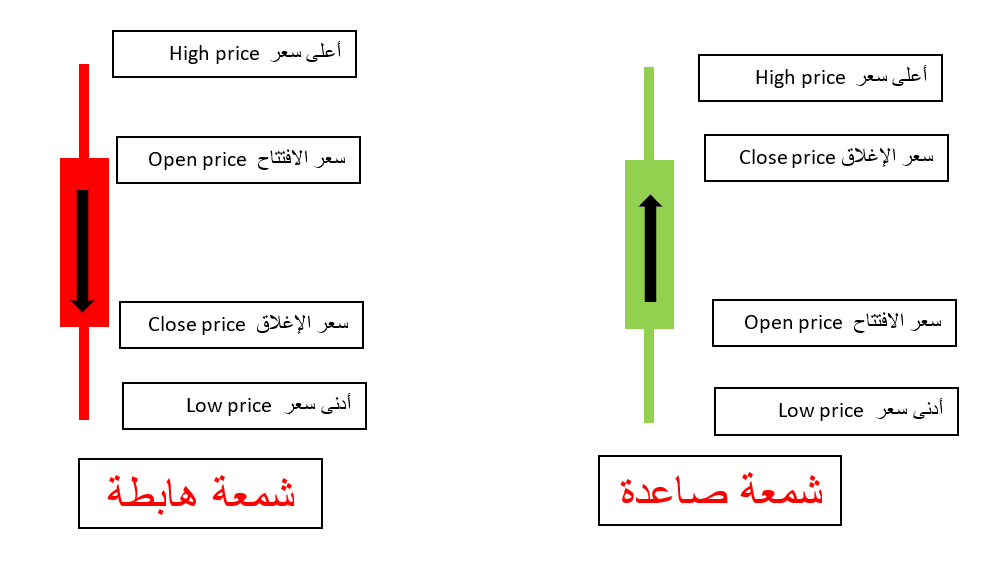
2️⃣ What are candlesticks?
Candlestick patterns are the most used method by traders to display prices.
Every candle tells you three important pieces of information:
The highest price the currency reached during that period.
The lowest price it reached.
Opening and closing price.
💡 Important Information:
If the candle is green: the price closed higher than the opening price (which means a rise).
If it is red: the price closed lower than the opening price (which means a drop).
---
3️⃣ Time Frame
It is the duration that each candle represents.
One-minute frame: each candle represents one minute.
Hourly frame: each candle represents one hour.
Daily frame: each candle represents a full day.
📌 Golden Tip:
Beginners start with larger time frames (daily, four-hour, or hourly) so the picture is clearer and less noisy.
---
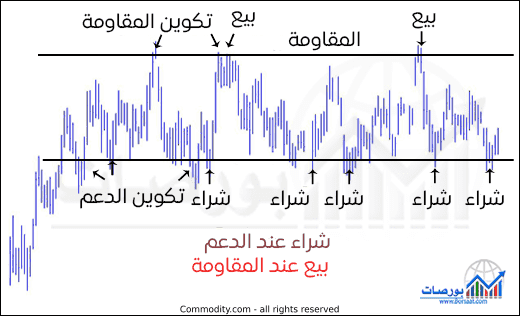
4️⃣ Support and Resistance Lines
Support: a price level where if the currency drops to it, it often stops falling and starts to rise.
Resistance: a price level where if the currency rises to it, it often stops rising and starts to fall.
A simple example: support is like the ground, and resistance is like the ceiling.
---
5️⃣ Technical Indicators
Tools that help you understand the market, such as:
Moving Average: shows the general direction of the price.
RSI: measures if the currency is 'overbought' or 'oversold'.
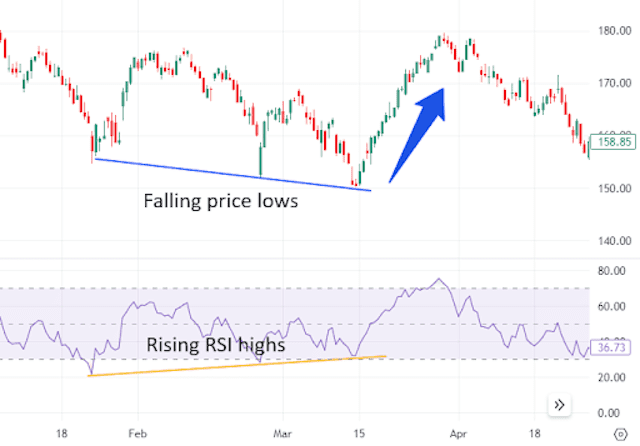
But don't rely on indicators alone… combine them with reading the chart.
---
🎯 Summary
Reading the chart is not magic; it is a skill that develops with practice. The more you look at charts and try to draw support and resistance or follow the frames, the more you will start to see patterns and predict movements before they happen.
Start with the basics; don't complicate things, and over time the chart will become like an open book to you 📖.
Follow me for more ♥♥♥♥♥


