
1️⃣ Key Support & Resistance Zones
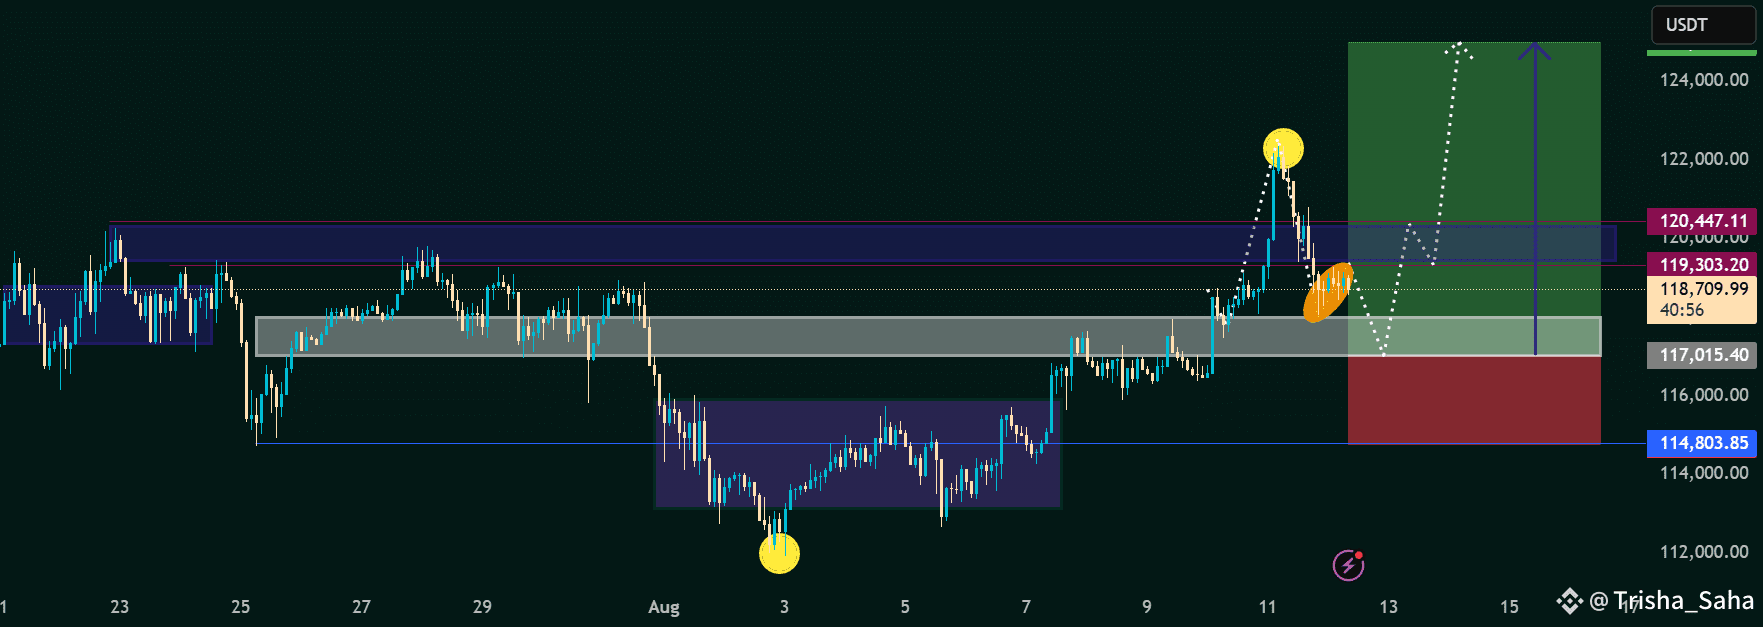
Major Resistance: 120,447 USDT (marked in magenta) – previously acted as a supply zone.
Near-term Resistance: 119,303 USDT – price recently rejected here.
Major Support: 117,015 USDT – strong demand area.
Lower Support: 114,803 USDT – final defense for bulls.
2️⃣ Current Price Behavior
After forming a double bottom (yellow circles) around 3rd August, price rallied strongly to break past the 118K zone.
Price tapped into the 120K supply zone and pulled back, forming a potential higher low (orange highlight).
Current candle is stabilizing around 118,561 USDT, above the key demand area.
3️⃣ Trade Idea (Marked on Chart)
Possible Scenario: Price may retest 117K–118K demand zone, then push back up toward 124K target (green box shows risk/reward plan).
Bullish Target: 124,000 USDT (continuation after demand zone hold).
Bearish Risk: Break below 117K could trigger deeper pullback toward 114.8K.
4️⃣ Technical Outlook
📈 Bias: Bullish continuation as long as price holds above 117K.
⚠️ Risk Factor: Watch for false breakouts and liquidity sweeps in the 117K zone before upside.
💡 Confirmation Needed: Bullish reversal candlestick in the grey demand zone
#DeFiGetsGraded #CPIWatch #BTCOvertakesAmazon #BTCReclaims120K #ETHTreasuryStrategy

