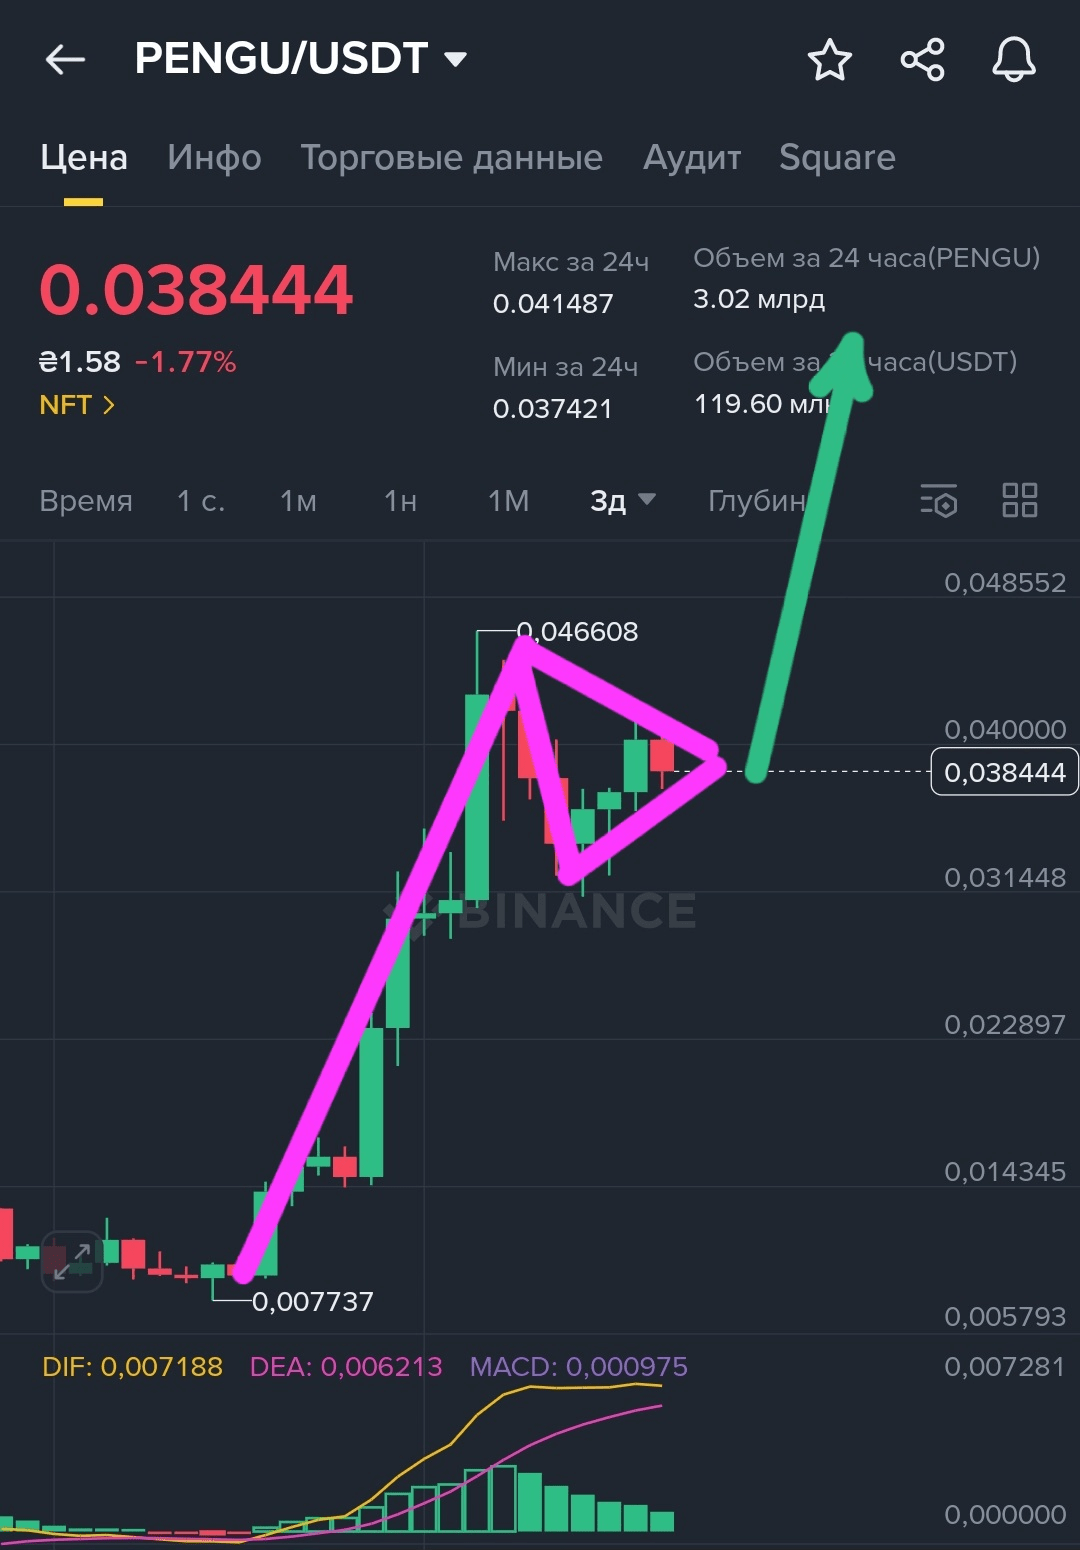
Current price: 0.038444
Pattern: Bullish flag (pennant)
Local maximum of the pattern: 0.046608
Local minimum of the pattern: 0.007737
What does the pattern show?
A bullish flag (pennant) on a 3-day chart is a classic trend continuation formation. It usually appears after a strong upward impulse, followed by consolidation in a narrow range with a downward slope.
Holding the price above the upper boundary of the pennant usually signals a resumption of growth with a new impulse.
Growth targets according to the pattern
The height of the flag (impulse) is considered as the distance between the local maximum and minimum of the pattern:
0.046608 - 0.007737 = 0.038871
We apply this height to the breakout level (local maximum of the pattern 0.046608):
Target price = 0.046608 + 0.038871 ≈ 0.085479
Key support and resistance levels
Support: ~0.0077 (lower boundary of the pattern) — an important level for maintaining the bulls' position.
Resistance: ~0.0466 (upper boundary of the pattern) — the breakout level at which it is important to hold for confirming growth.
Alternative scenario
If the price does not hold the support level and breaks below the local minimum of 0.0077, a reversal and movement to lower levels is possible.
Sideways movement and prolonged consolidation before a new trend is also possible.
Risks and recommendations
Trading volume is an important indicator for confirming a breakout. Watch for an increase in volume when moving above 0.0466.
It is important to consider news and the overall market background, as external factors can influence price behavior.
Use stop-losses to limit losses in case of a false breakout.