
At the time of writing, Pi Network recorded a slight increase of 3%, maintaining above the $0.40 level after breaking the bullish pattern last weekend. This movement has attracted attention from large investors, as many whale wallets have aggressively accumulated with expectations of a strong recovery.
However, despite the inflow of capital from major players, technical signals have not yet fully supported the bullish trend. The upward momentum is showing signs of weakening, indicating that market sentiment remains cautious and has not clearly established the next trend.
Whales Seize Strong Accumulation
Data from PiScan reveals that large investors have taken advantage of the price correction of Pi Network (PI) to accumulate on a large scale. In the past 24 hours, four of the five largest transactions on the network involved a whale making direct purchases from the OKX exchange. In total, this whale has accumulated over 2.25 million PI tokens, equivalent to approximately $901,500 at current market prices.
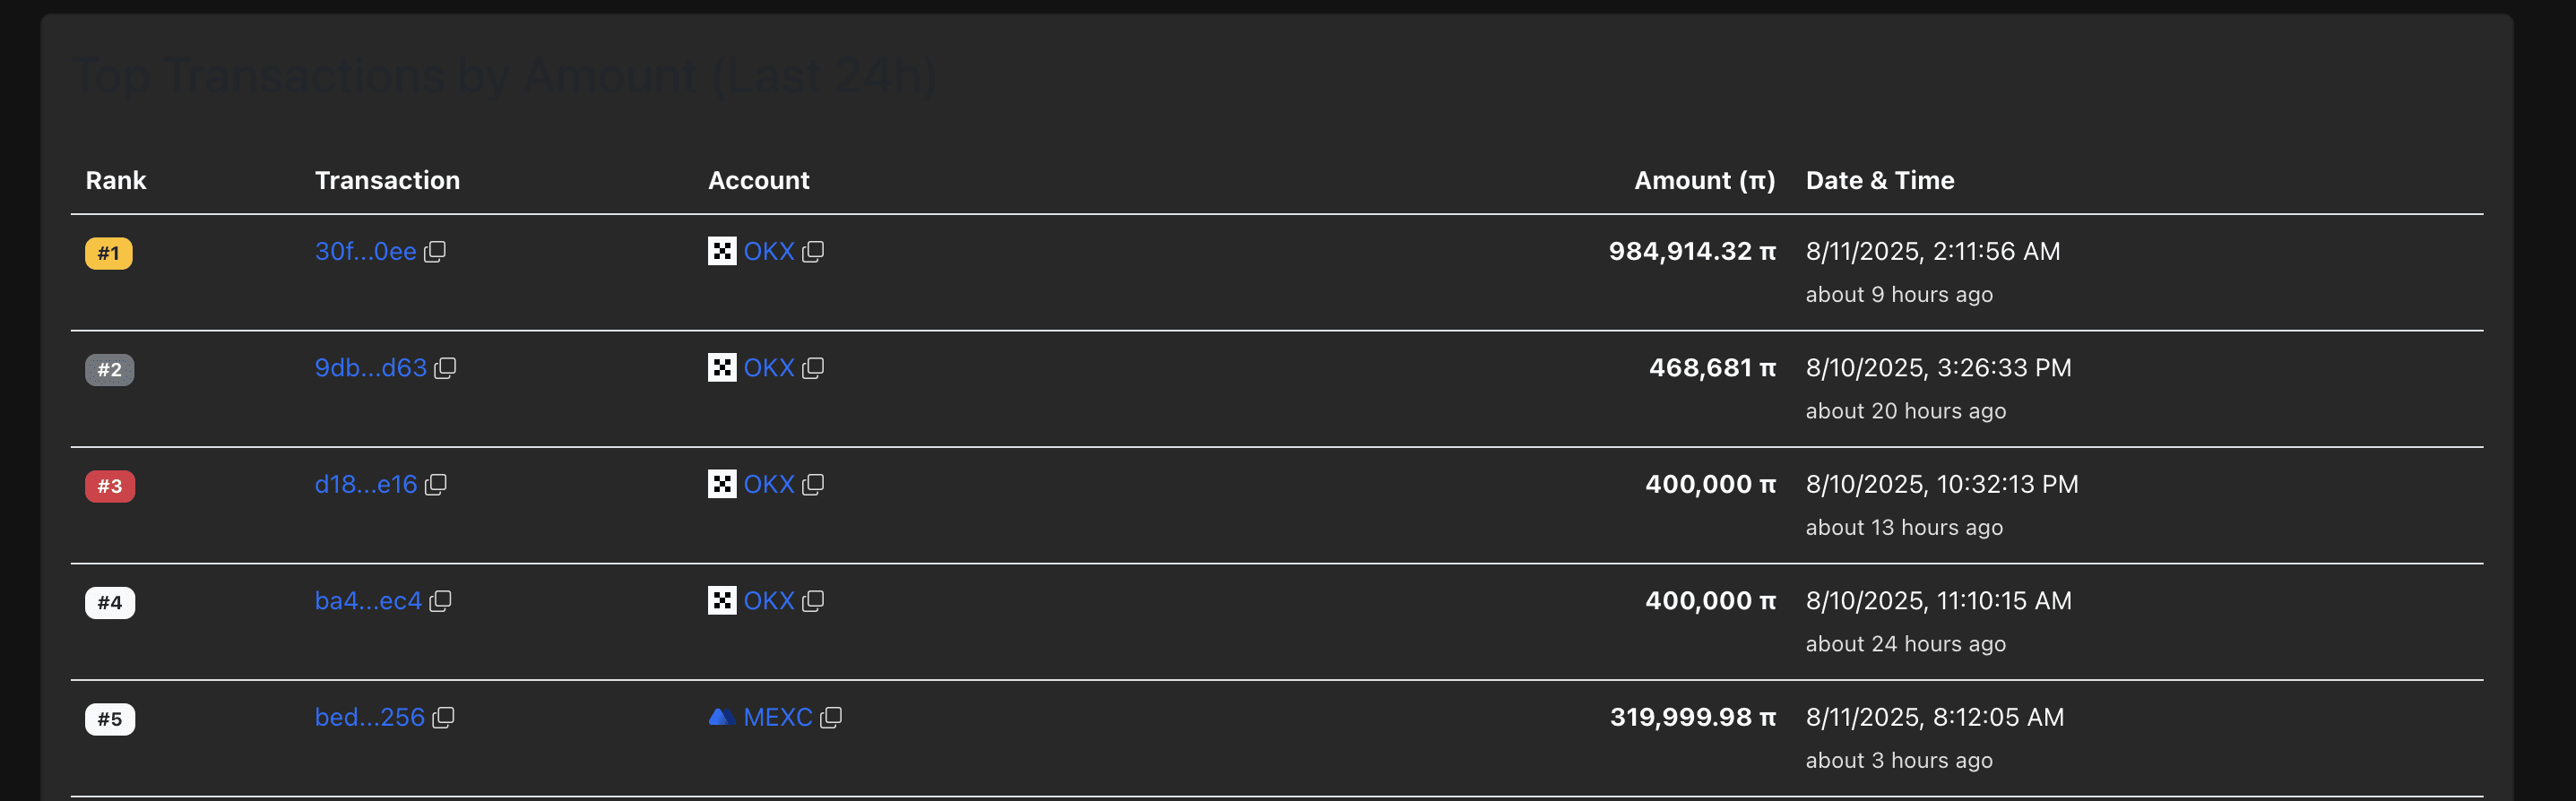
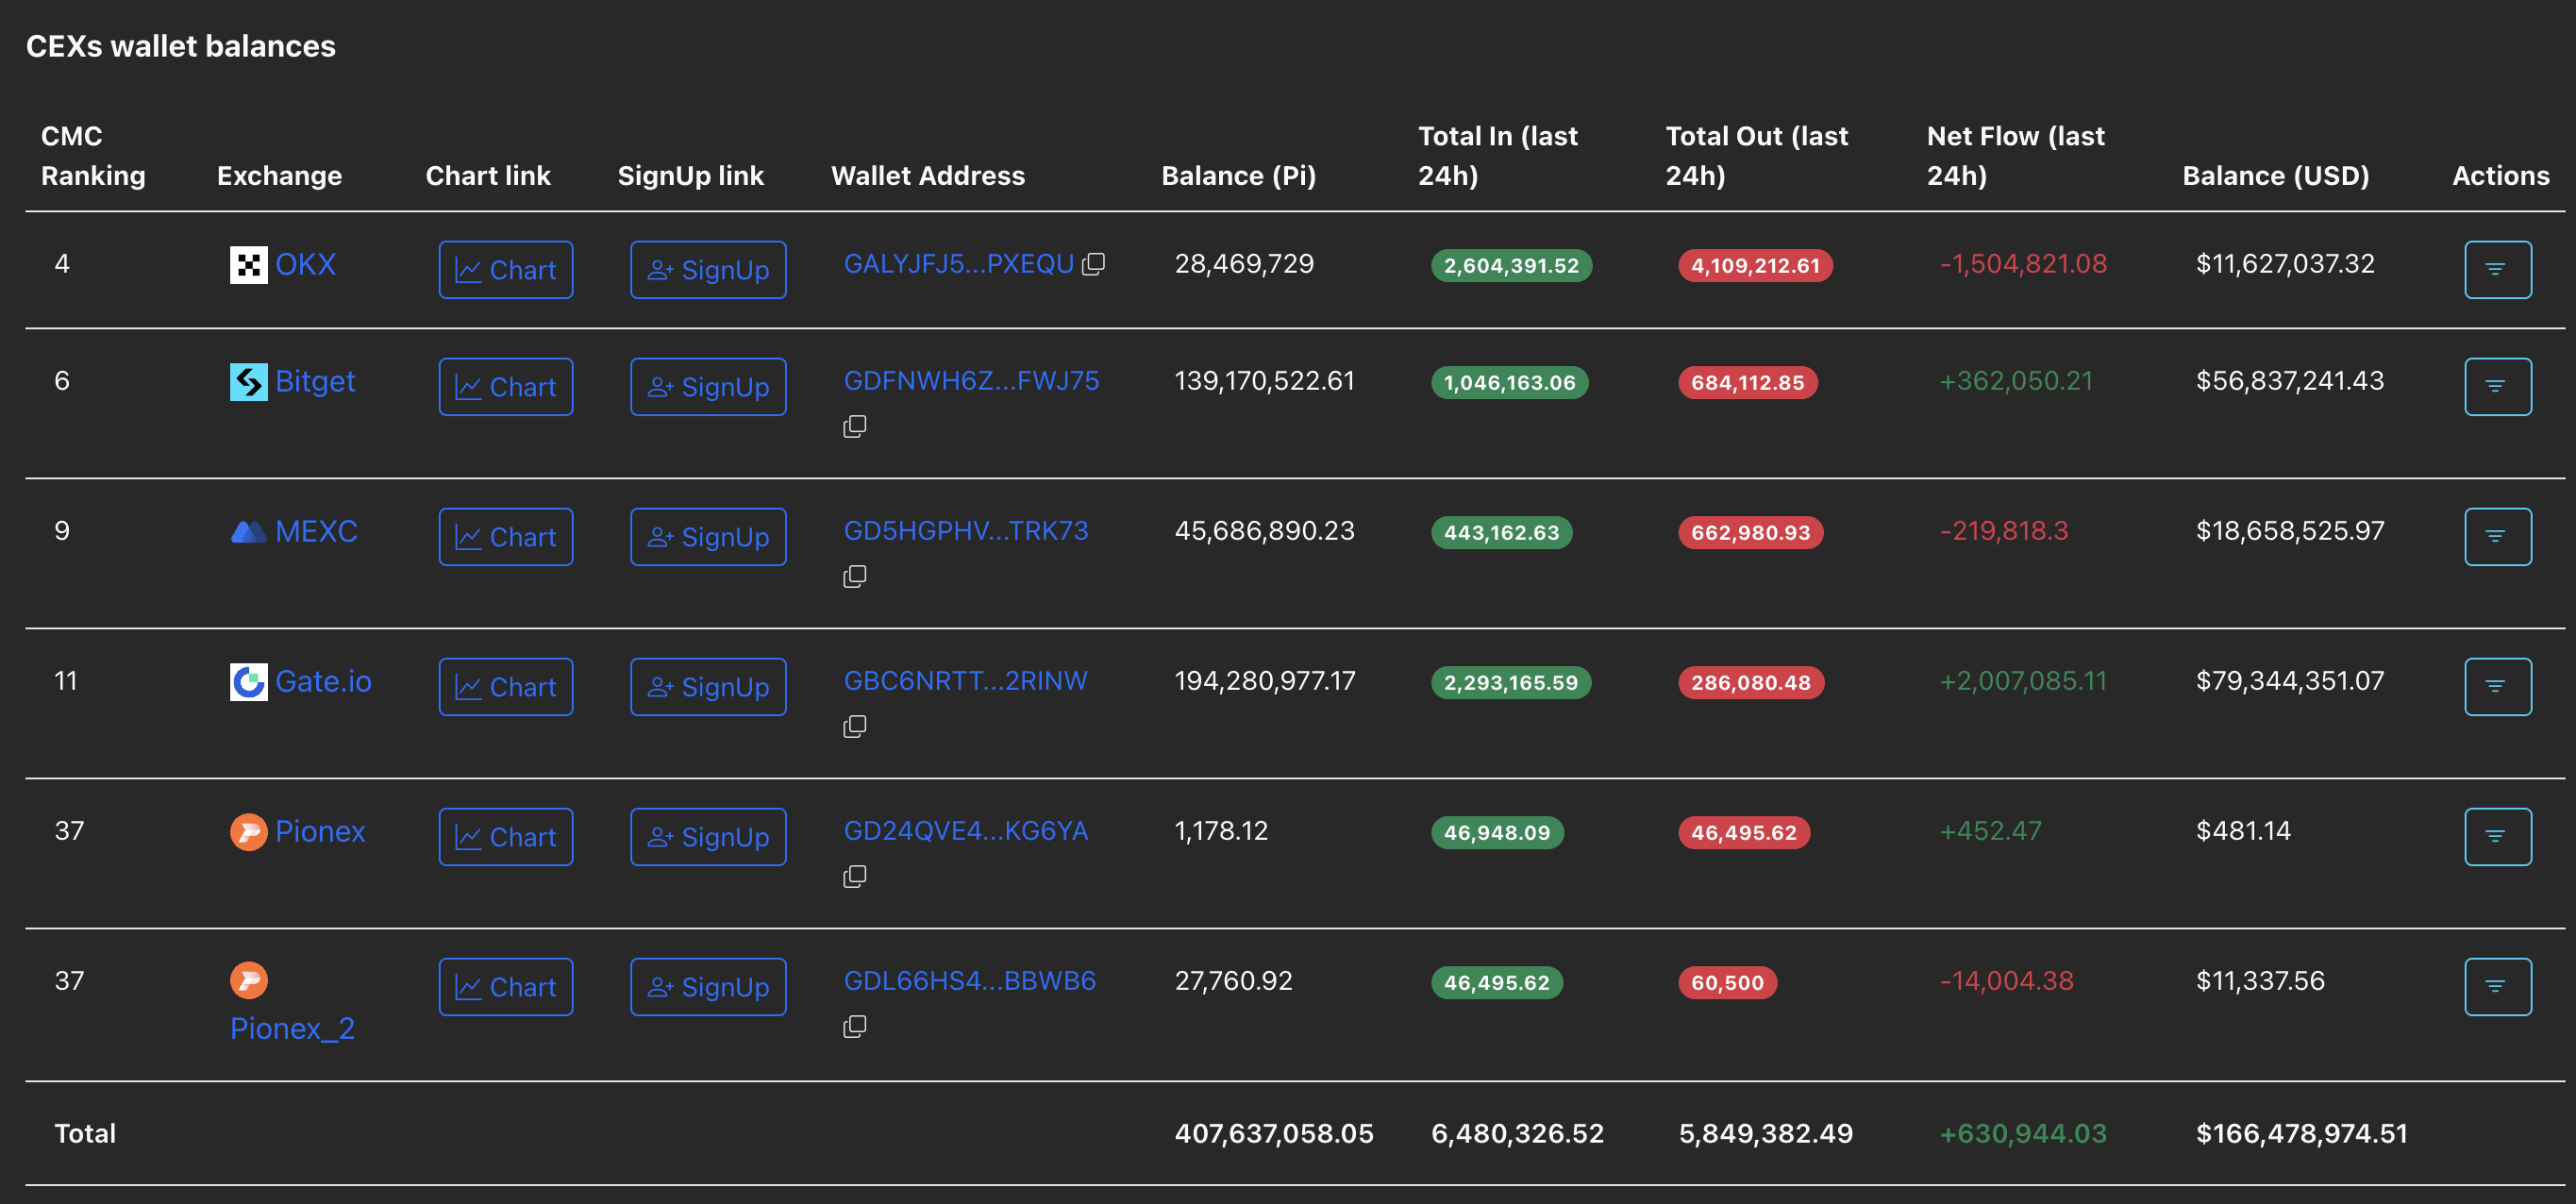
Notably, a single whale wallet purchased nearly 985,000 PI tokens in just one day, raising the total holdings to an impressive 351.74 million tokens. According to the latest data as of Monday, the amount of tokens held by this investor now far exceeds any centralized exchange (CEX), indicating a significant level of control and influence over the circulating supply.
This accumulation movement indicates the long-term confidence of large investors, despite short-term technical signals still being unclear. This may act as a psychological support for the market in the coming sessions, especially if the price holds firm above the important support level.
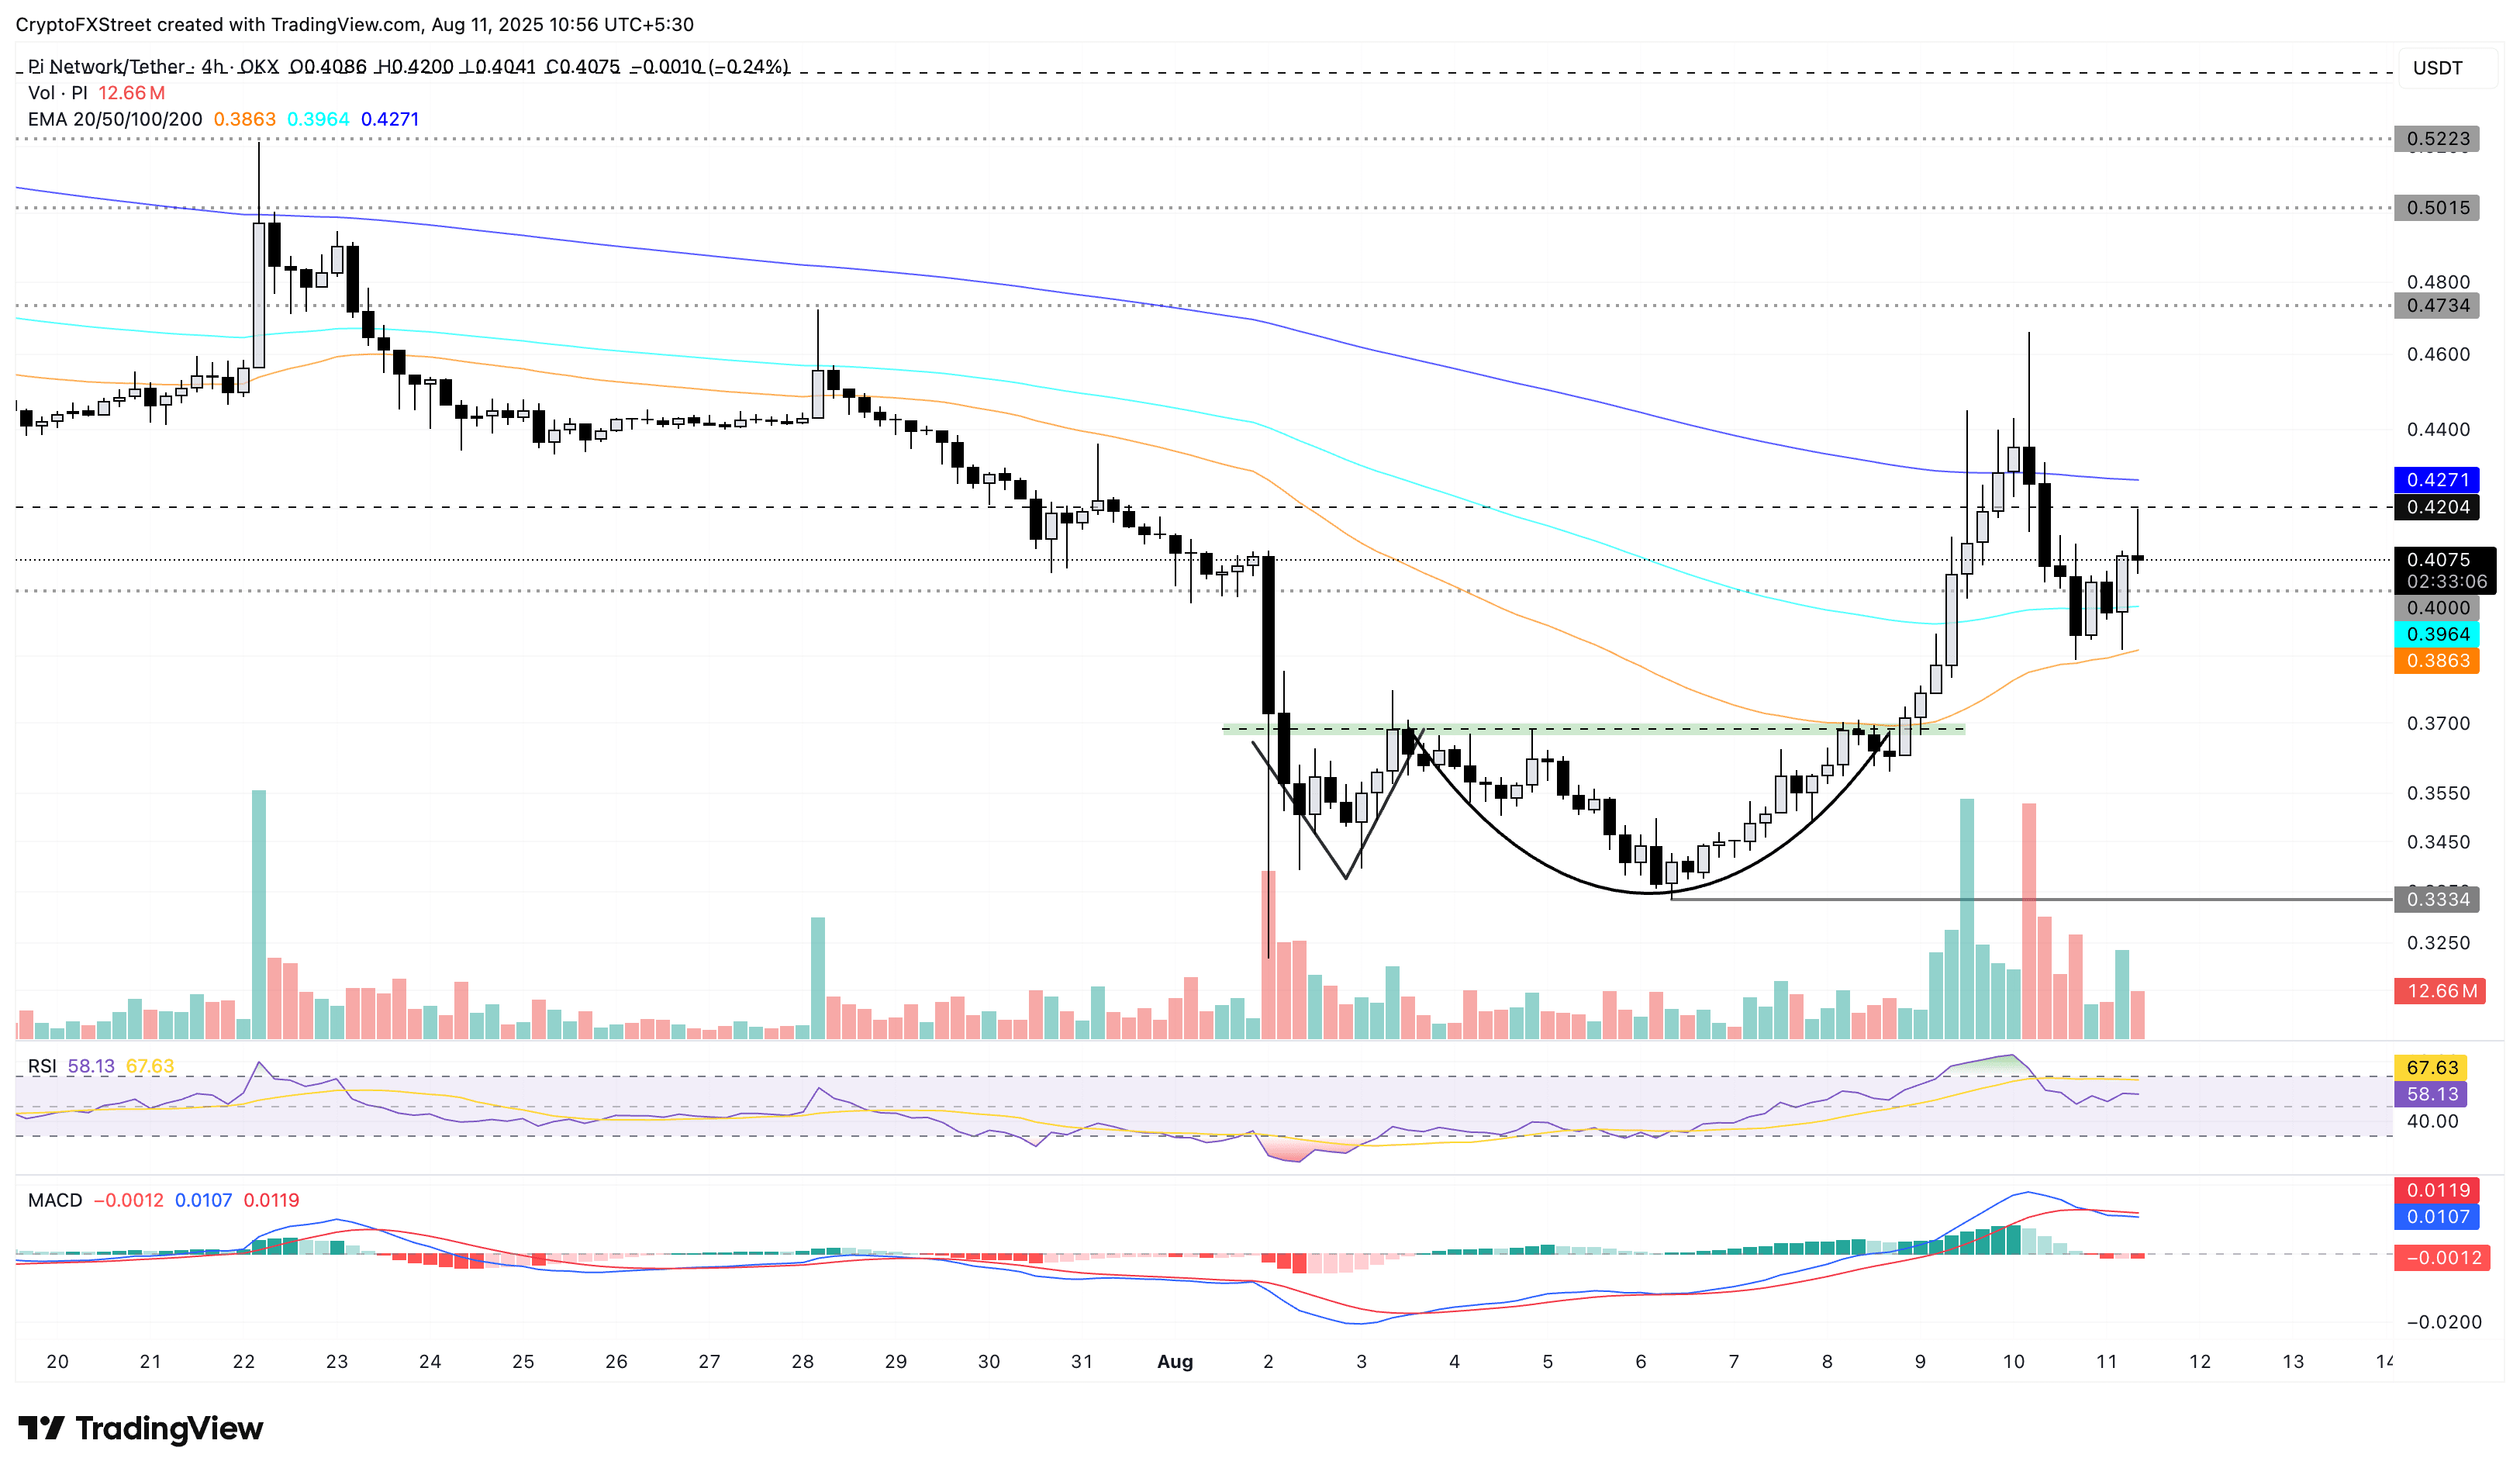
Pi Network Retests the $0.40 Level After Breaking the Adam & Eve Pattern
The PI token recorded a positive recovery after breaking the bullish Adam & Eve pattern repeated on Friday. The rally pushed the price to a peak of $0.46 on Sunday before reversing and closing in the red at $0.39.
However, buying pressure returned as PI bounced off the 50-period EMA ($0.38) on the 4-hour chart, increasing by more than 3% as of Monday and reclaiming its position above the psychological level of $0.40.
The RSI indicator is currently at 58, steadily oscillating around the average after exiting the overbought zone. This movement reflects a slight cooling in market conditions, thereby facilitating a healthier accumulation base before establishing the next trend.
Meanwhile, the MACD indicator on the 4-hour timeframe is still moving sideways, following a sell signal that appeared on Sunday when the MACD line crossed below the signal line. This signal indicates a lack of short-term bullish momentum, but also opens up the possibility of a reversal if capital flows return and buying pressure intensifies.
If PI can reclaim the 200-period EMA at $0.42, the recovery momentum could be solidified, opening up room for the price to retest the resistance area of $0.47 — a level that was previously tested on July 23, marking one of the key short-term peaks in the past month.
Conversely, if the support zone at the 100-period EMA around $0.40 is breached, selling pressure could increase, pulling the price back to retest the 50-period EMA at $0.38 — a level that has previously served as a springboard for the most recent price surge.
Although technical indicators are sending mixed signals, the price structure of PI still holds the expectation of recovery if the $0.40 level continues to be defended. The strong accumulation by whales is also reinforcing confidence in a bullish scenario in the short term.

