2014 → $1,150 to $200
2018 → $20,000 to $3,200
2022 → $69,000 to $15,500
2026> $123,000 to $45,000
Bitcoin’s Halving Formula → Market Cycles
Formula Recap:
S(t) = 50 \times \left(\frac{1}{2}\right)^{t/4}
Halves every 4 years → 25, 12.5, 6.25, 3.125 BTC/block
Supply growth slows → scarcity increases → price tends to rise
Cycle Connection
1. Halving Year (t = 0, 4, 8, …)
Supply cut in half instantly.
Miners have fewer BTC to sell → selling pressure drops.
Market doesn’t react immediately — price often consolidates.
2. Post-Halving Bull Phase (~Months 6–18)
Reduced supply meets steady/increasing demand.
FOMO kicks in as price breaks previous highs.
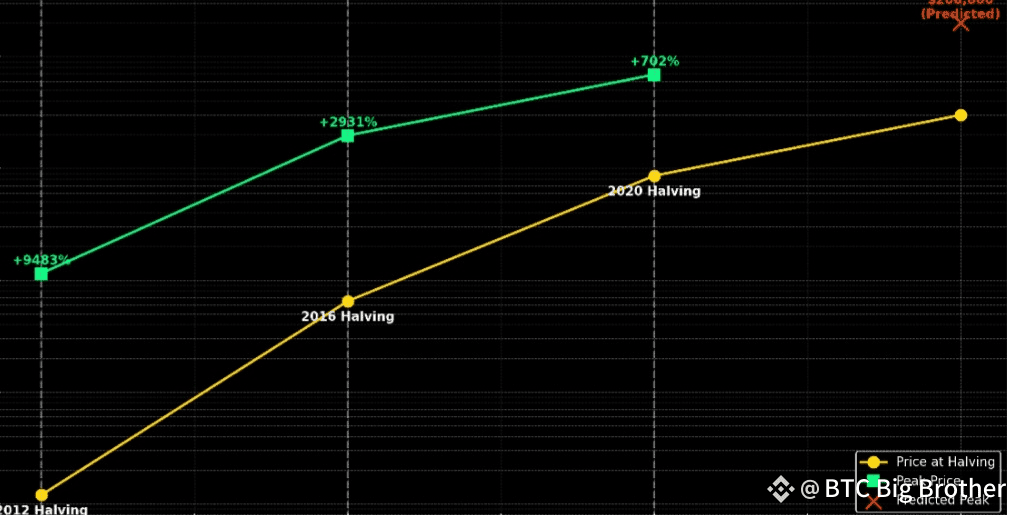
Example:
2012 Halving → BTC from ~$12 to $1,150 (2013)
2016 Halving → ~$650 to $20,000 (2017)
2020 Halving → ~$8,700 to $69,000 (2021)
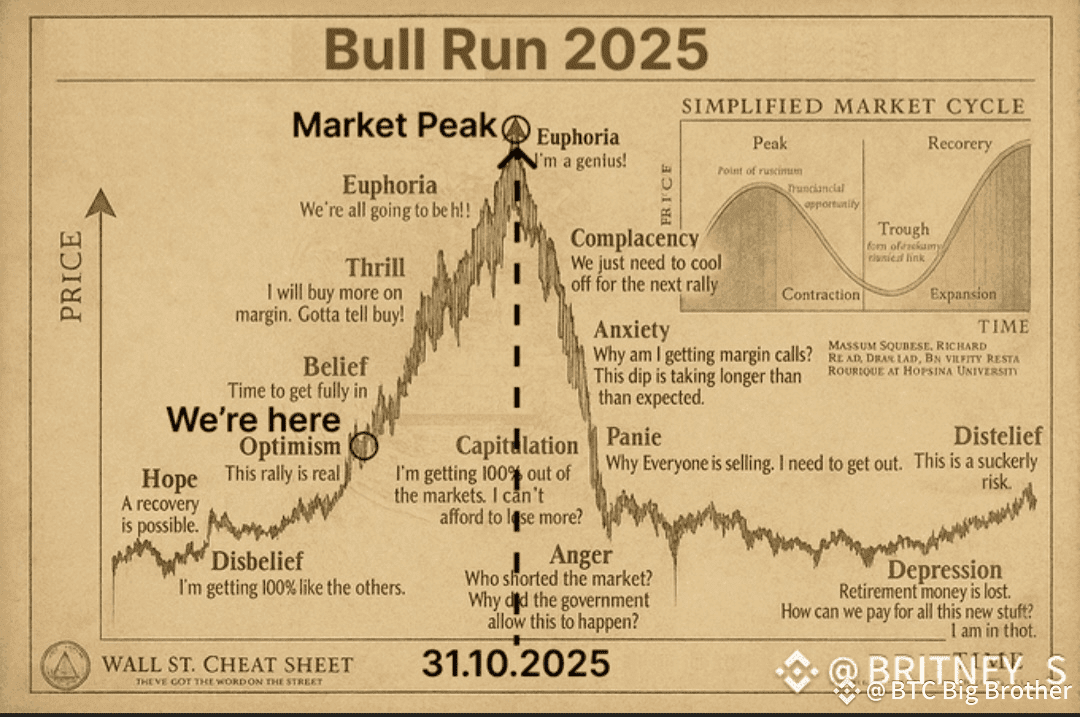
3. Blow-Off Top (~Months 18–24)
Speculation peaks, retail rushes in.
Price surges far above fair value.
Often followed by sharp correction.
4. Bear Market (~Months 24–36)
Profit-taking + miner capitulation.
Price drops 70–85% from top.
Example:
2014 → $1,150 to $200
2018 → $20,000 to $3,200
2022 → $69,000 to $15,500
5. Accumulation Phase (~Months 36–48)
Smart money buys quietly.
Low volatility, price ranges sideways.
Ends as new halving approaches → cycle repeats.
✅ Why it works:
Predictable supply shock every 4 years.
Market psychology + scarcity economics.
Demand drivers (adoption, macro events)