LDOUSDT Daily Chart Analysis | Strong Momentum Building
🔍 Let’s dive into the LDO/USDT perpetual contract and analyze the latest price action, highlighting a powerful bullish setup and key technical signals on the daily chart.
⏳ Daily Overview
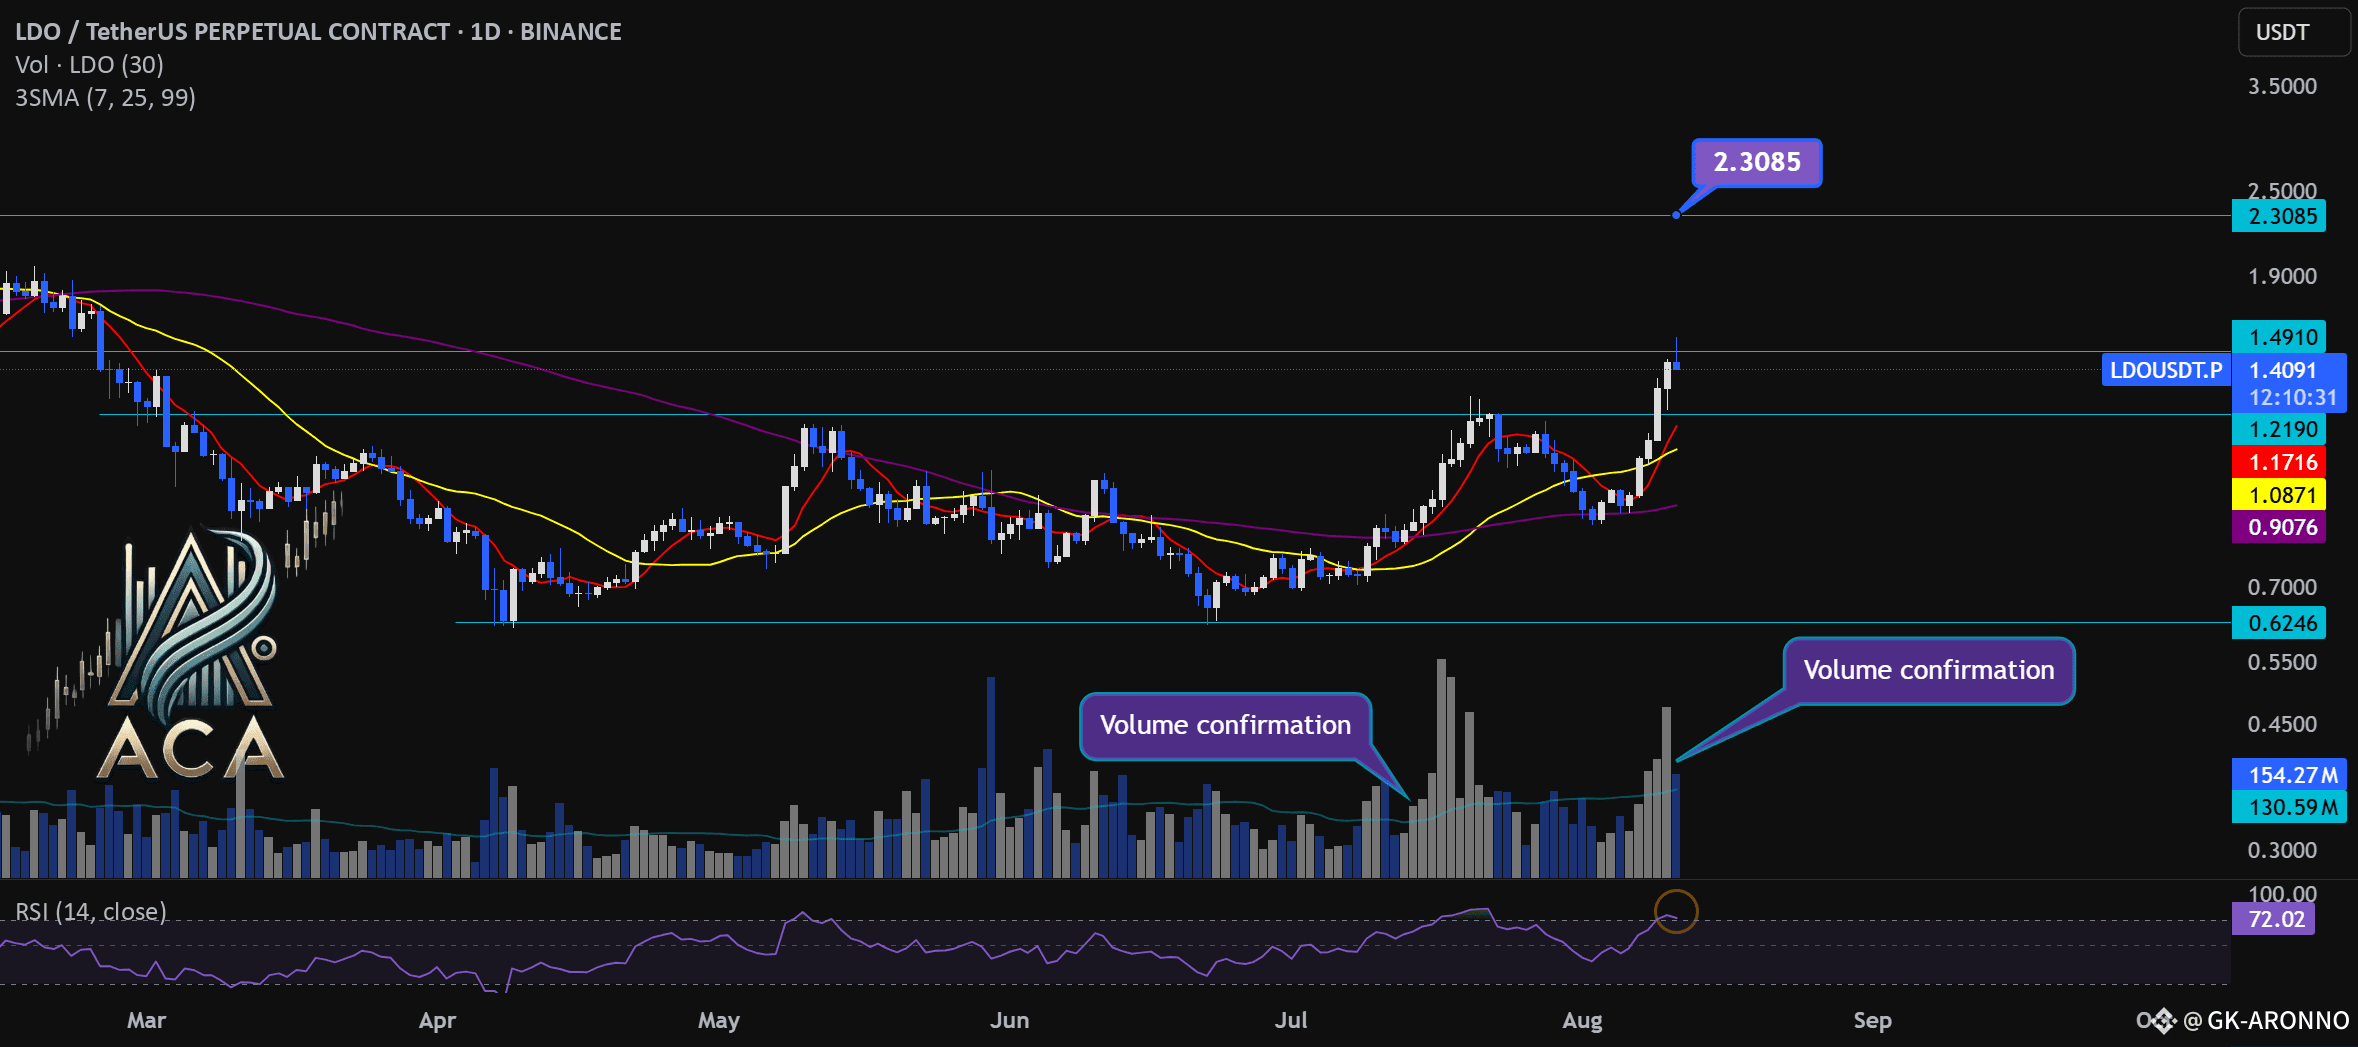
The daily chart reveals a strong surge in momentum as the price breaks out of its recent range, accompanied by a decisive uptick in trading volume. The 3SMA setup (short-term, mid-term, and long-term moving averages) is aligning bullishly, marking the beginning of a strong uptrend.
📊 Key Highlights:
- RSI (14) is entering the overbought zone (currently at 73.39), reflecting surging buyer demand and intensifying momentum.
- Price has broken out of the range box with elevated volume, confirming the move.
- Multiple volume confirmation spikes signal conviction behind the breakout.
- Immediate resistance is being challenged; the next key target to watch is $2.3085.
- For continued upside, we must see a daily candle close with solid volume above the current resistance level.
🚨 Conclusion:
Momentum is clearly accelerating on LDOUSDT, supported by volume and moving average bullish alignment. If price closes above resistance with strong volume, a continued rally toward the $2.3085 target is likely. Keep an eye on RSI levels and volume for further confirmations as this trend builds!
