Cardano (ADA) maintains its upward trend, currently trading above the $0.82 mark on Monday morning, continuing a nearly 11% increase from the previous week. In the derivatives market, the open interest (OI) of ADA continues to rise alongside a positive funding rate, indicating that bullish sentiment is spreading among traders. Technical signals also reinforce the possibility of a breakout, as a series of momentum indicators lean towards the scenario of continued price increases.
Cardano's derivative data indicates a bullish trend.
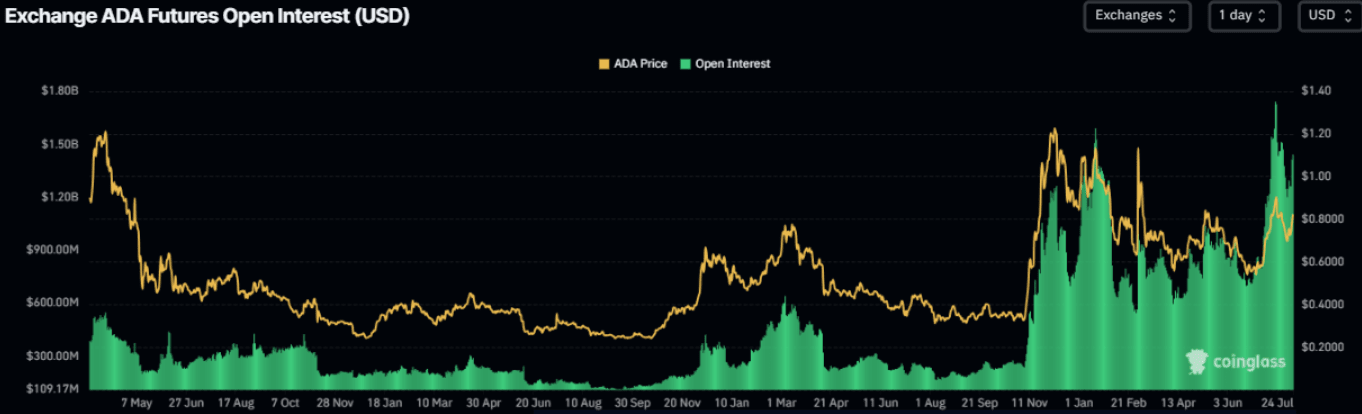
The open interest (OI) of Cardano futures contracts on exchanges rose from $1.20 billion on August 3 to $1.44 billion on Monday — the highest level since the end of July — and continues to maintain an upward trend. The increase in OI indicates that new capital is flowing strongly into the market, reflecting active new buying, which may provide additional 'fuel' for the current uptrend of ADA.
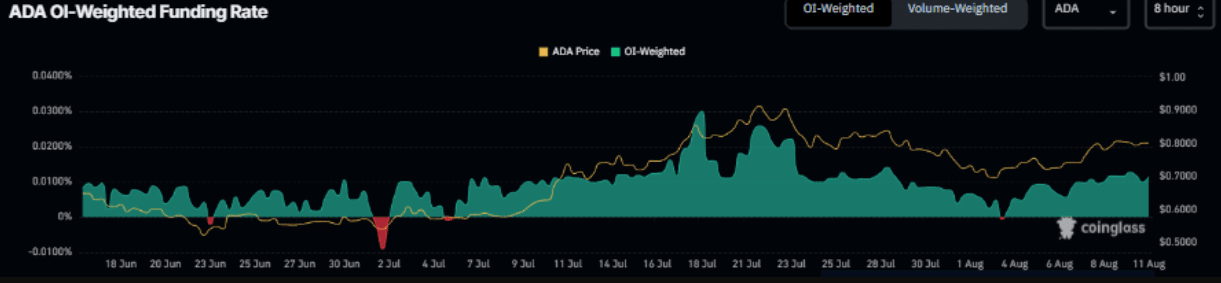
Not only OI, but Cardano's funding rate also recorded a notable turning point as it reversed from negative to positive last week and has been continuously improving. This means that buyers (Long) are willing to pay fees to sellers (Short) — a signal indicating that market sentiment is decidedly leaning towards the positive. In the past, such strong reversals have often coincided with explosive price increases of ADA.
Cardano price forecast: Momentum indicators reinforce the bullish trend.
On August 3, Cardano (ADA) bounced from the important support zone of $0.70, recording an increase of nearly 15% as of Sunday. By midday Monday, the upward momentum continued, pushing ADA above the $0.82 threshold with an additional increase of about 3%.
If it can maintain momentum and close above the resistance zone of $0.84 on the daily chart, ADA could extend its rally towards the peak of $0.93 established on July 21.
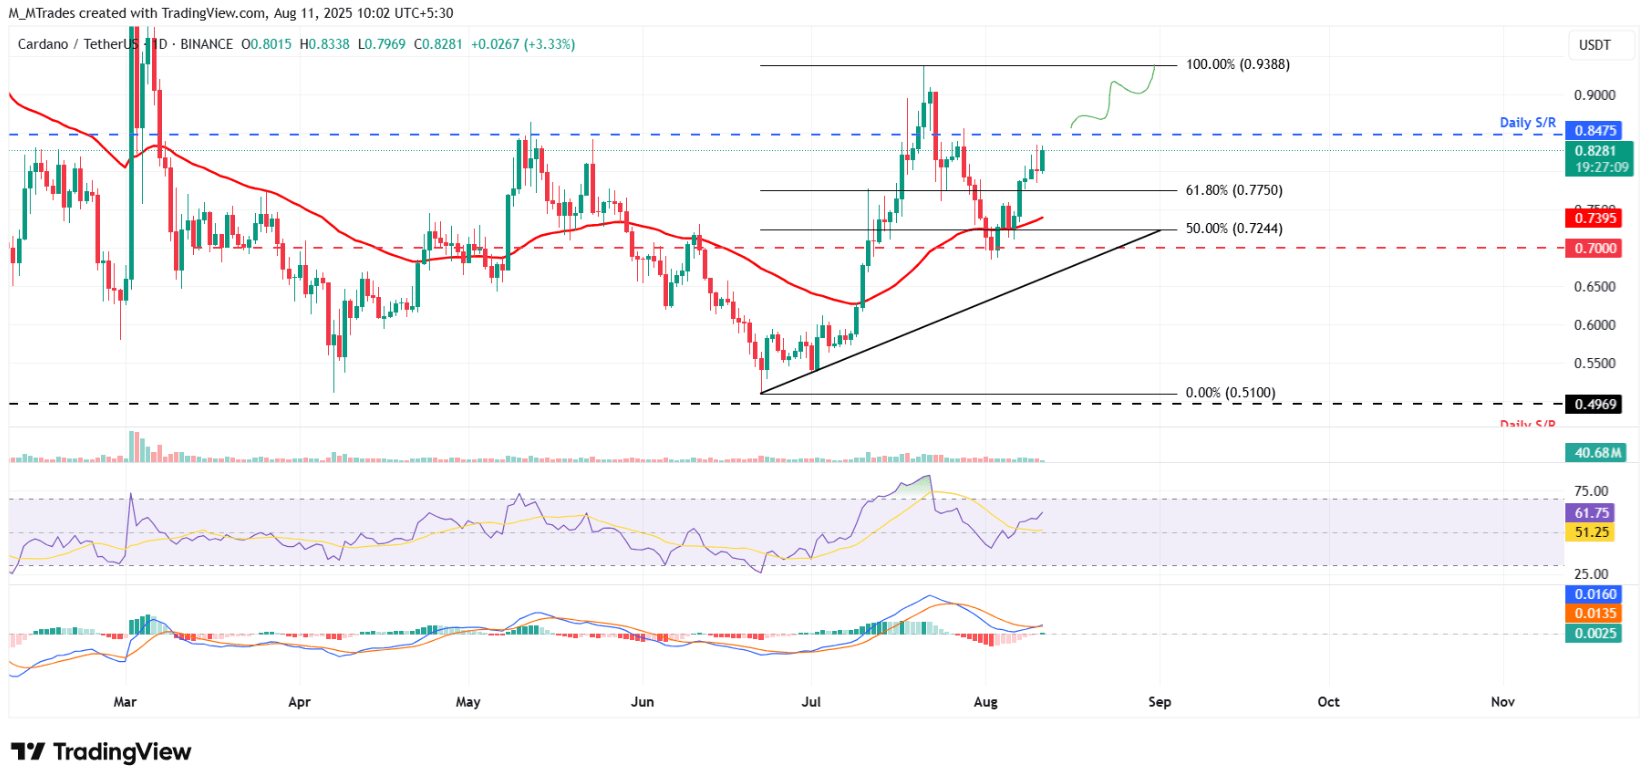
Technical signals are supporting a breakout scenario. On the daily chart, the relative strength index (RSI) has reached 61, surpassing the neutral threshold of 50, reflecting increased buying pressure. At the same time, the MACD indicator has just shown a bullish cross – a signal often indicating the start of an upward trend.
However, if it fails to close above $0.84 and faces selling pressure, ADA risks turning around to retest the support zone around the 61.8% Fibonacci retracement level at $0.77.