
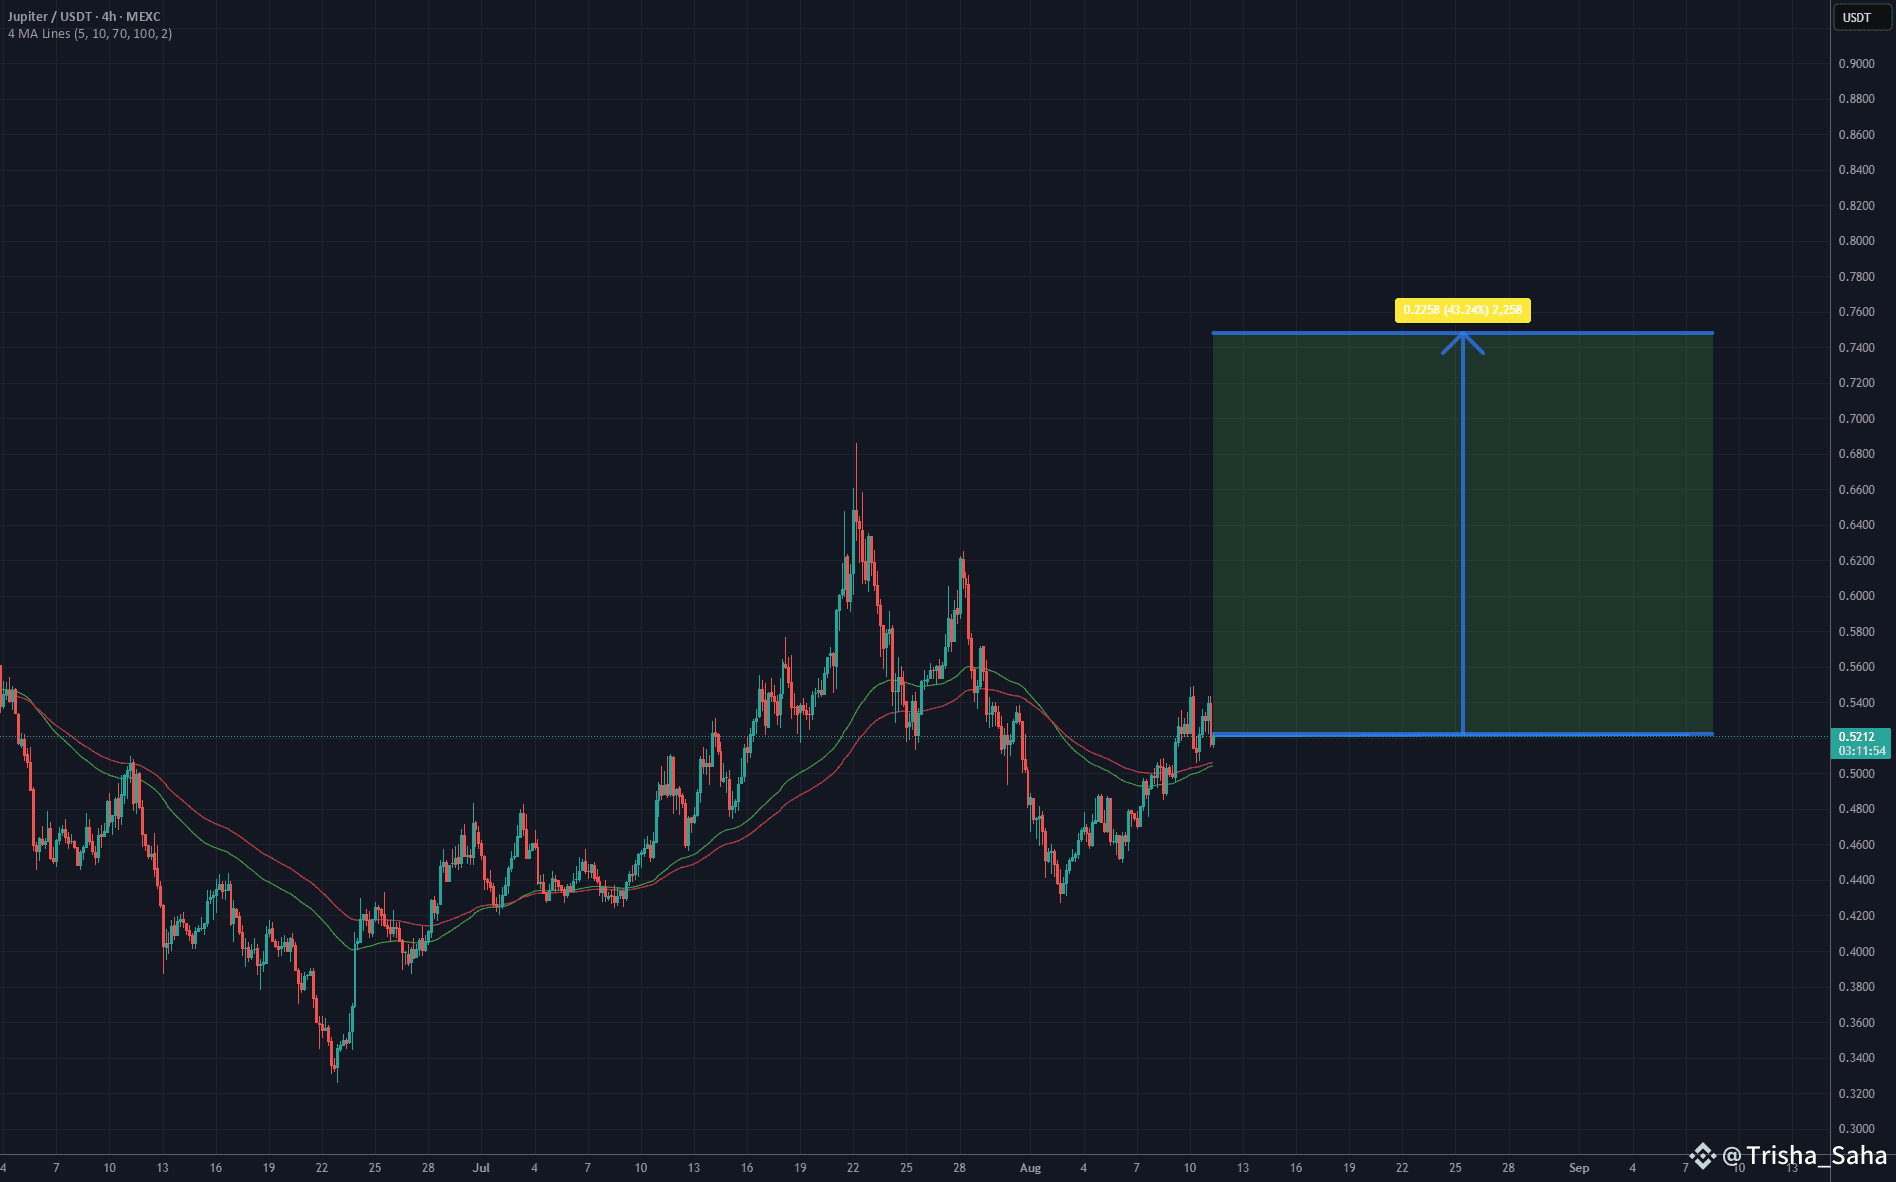
On the 4-hour chart of the Jupiter/USDT pair, we can see a strong upward move following a previous sharp decline that found support around the 0.43 USD level. Since then, the price has rebounded and started forming a sequence of higher lows, suggesting a short-term shift towards bullish sentiment.
Key observations:
Rebound from support: After the drop to around 0.43 USD, the price bounced and established a series of rising lows, which is an initial sign of buying strength.
Moving Averages (MA): The green (short-term) moving average has started crossing above the red (long-term) one, which can be an early signal of a trend reversal towards the upside.
Market structure: The chart shows a potential “V-shaped” reversal pattern, where a breakout above 0.55 USD could open the way for further gains.
Bullish scenario:
If the current sideways correction in the 0.50–0.54 USD range ends with an upward breakout, the price could first move toward 0.60 USD and then to 0.75 USD, which aligns with the previous highs from mid-July. This scenario becomes more likely if the breakout is supported by increased volume and the price holds above 0.55 USD.
Potential TP: 0.75 $

