Bulls #Ethereum make a strong case for an ETH price rally to $10,000 or higher in the next six to eight months.
Key takeaways:
Ethereum is breaking through several bullish setups on the price chart.
Analysts predict that $ETH will soon rise to $6,000 and may reach $20,000 within a year.
Ethereum has risen approximately 24% this week, surpassing $4,330, the highest price since December 2021. Many analysts are now expecting a breakout above the record level of $4,950.
The Wyckoff pattern breakout on Ethereum aims for $6,000
Ethereum shows breakout signals from the prevailing Wyckoff accumulation model
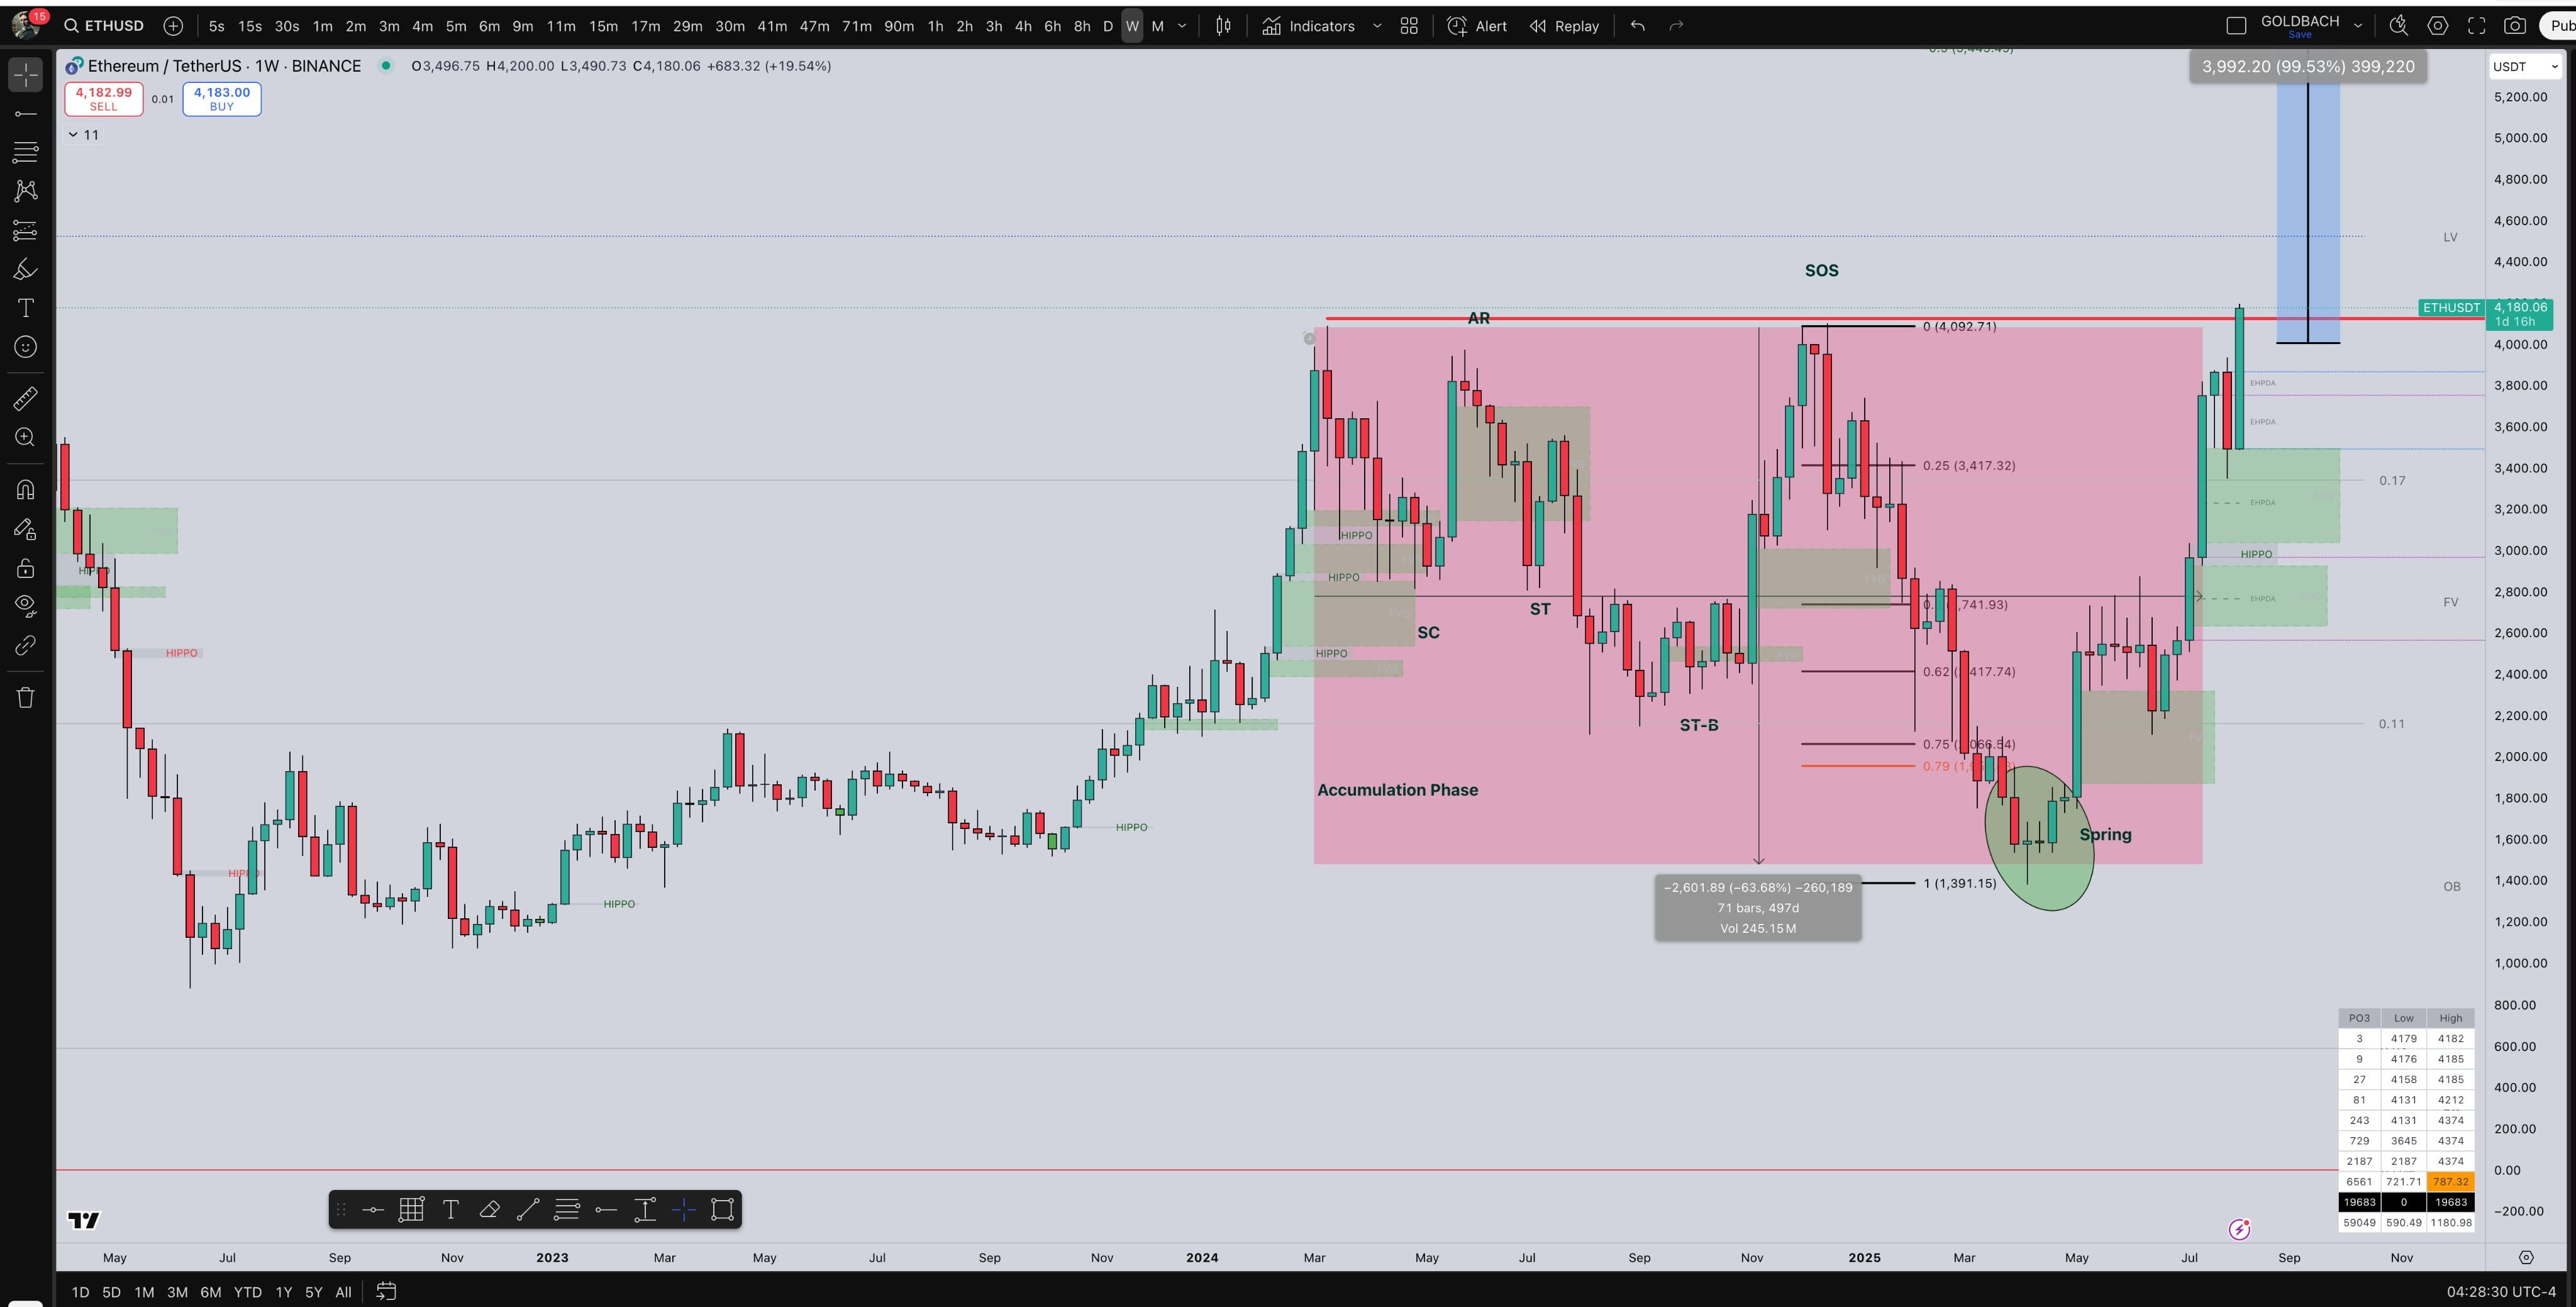
The ETH/USD pair has been trading for several months in a large accumulation range, steadily absorbing selling pressure. According to Wyckoff theory, this phase often ends with a decisive breakout once buyers gain control.
This breakout seems to have already begun, with ETH surpassing the resistance zone at $4,200, a stage known as the 'Sign of Strength' (SOS).
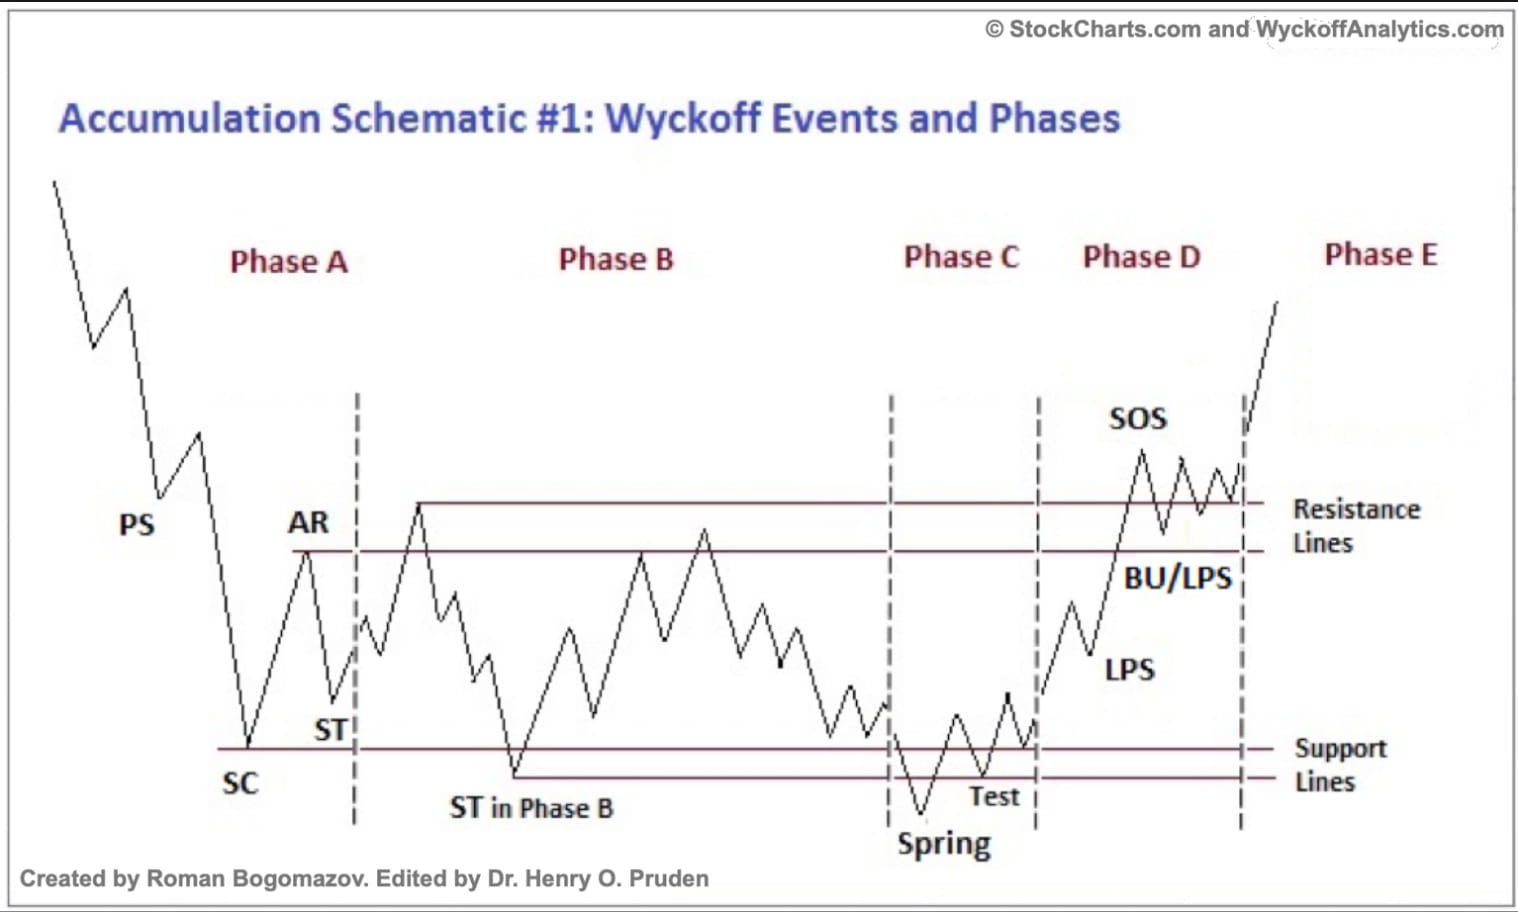
In the Wyckoff model, this is typically followed by a short pullback, or 'Last Point of Support' (LPS), to confirm a new uptrend.
If the LPS holds, the price enters a markup phase where the rise accelerates as demand exceeds supply. Measuring the height of the accumulation range gives a technical target of around $6,000.
The triangle setup indicates a target price for Ethereum at $8,000
As of Sunday, ETH broke above the upper trend line of its multi-year symmetrical triangle, located in the $4,000–$4,200 zone
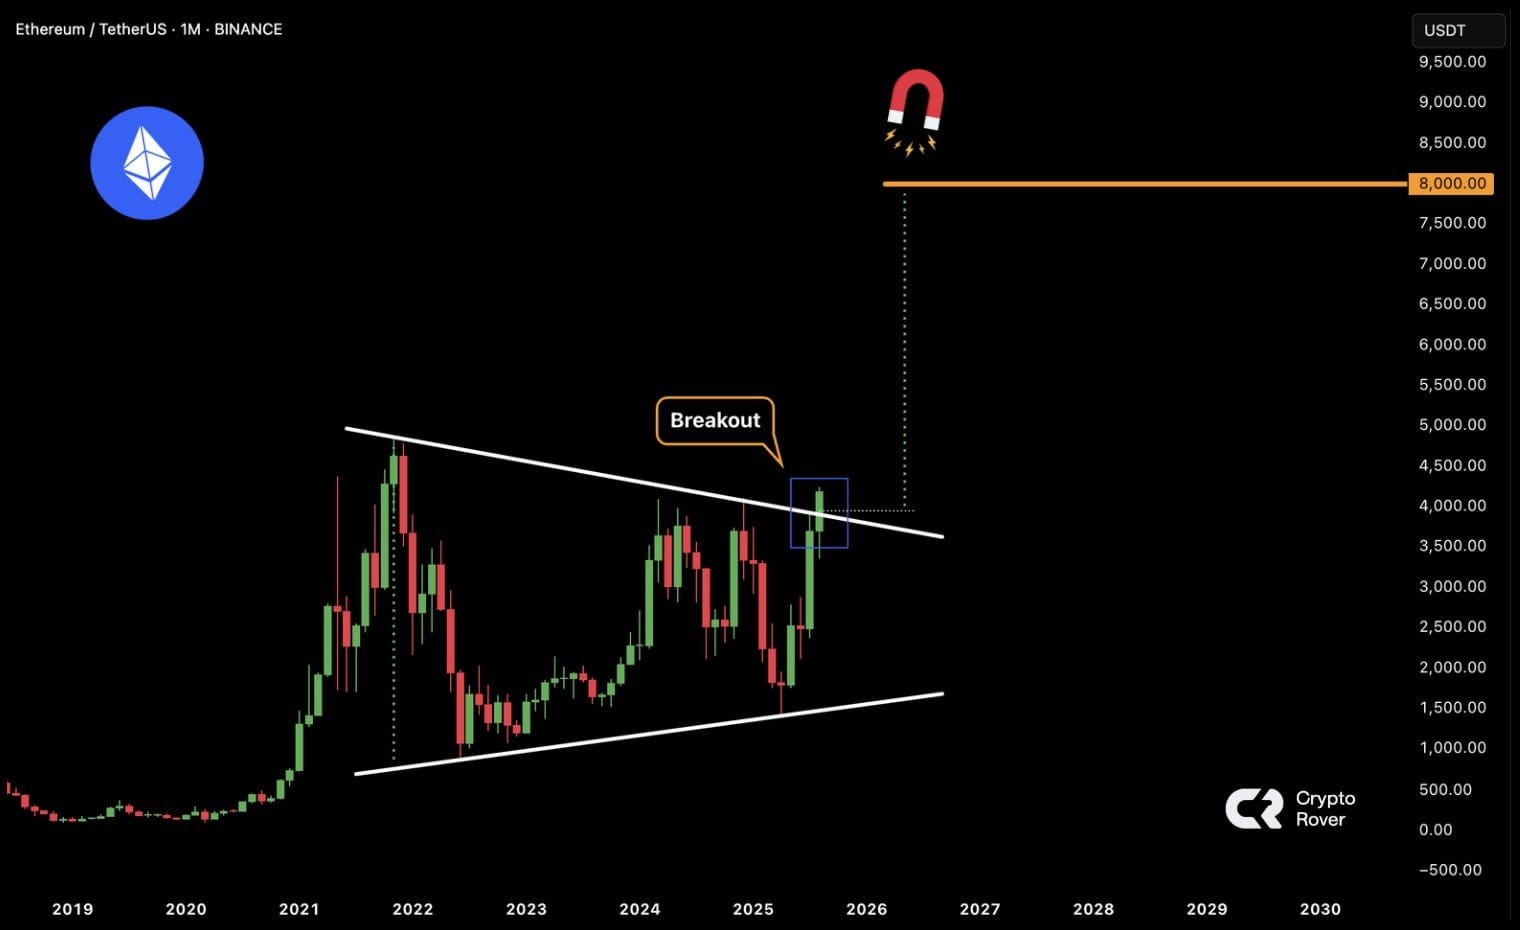
The breakout suggests a potential measured move equal to the maximum height of the triangle, indicating a range of $8,000 in the coming months. This is more than 90% above the current price level.
Historically, such long-term breakouts on higher timeframes $ETH preceded strong multi-month rallies, especially when confirmed by increased volume and favorable macroeconomic sentiment.
In April 2020, ETH broke out of a symmetrical triangle, rising more than 950%, reaching the planned target, and moving even higher amid increased bullish sentiment.
ETH price fractal justifies the $20,000 mark
Ethereum may be on track for $20,000 within 6-8 months if historical price fractals play out.
a recurring pattern emerges when #ETH sharply rises after retesting the primary lower support.
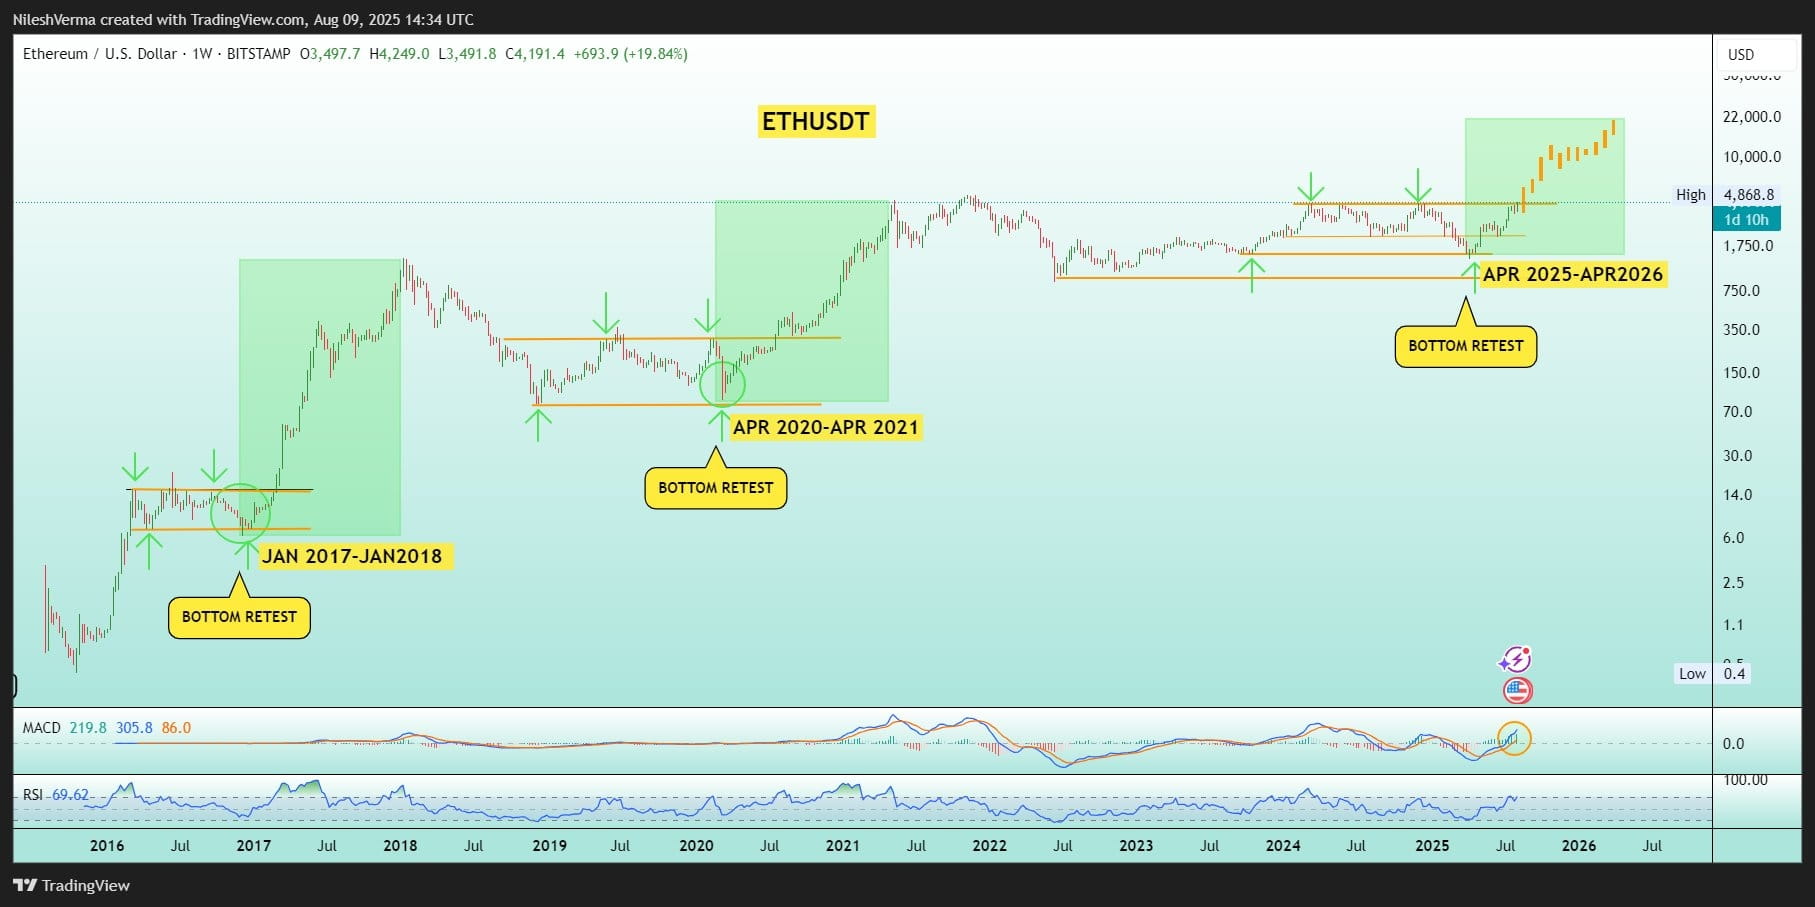
In January 2017 and April 2020, such retests preceded parabolic upward trends, providing growth of more than 8,000% and 950%, respectively. Both moves lasted around 12 months before reaching their peak.
$ETH repeated the same 'retesting the bottom' setup in April 2025, bouncing sharply from the $1,750–$1,850 zone. A sustained rally may continue until April 2026, with the weighted fractal movement targeting 'a minimum of $10,000' and $20,000 in the best case.