
Date: Mon, Aug 11, 2025 | 03:45 AM GMT
The cryptocurrency market is in full bullish swing as Ethereum (ETH) breaks above the $4,300 mark for the first time since 2021. This 20% weekly surge has lifted sentiment across the sector, igniting strong rallies in major altcoins— and LayerZero (ZRO) is among the standout gainers.
$ZRO has notched an impressive 21% daily gain, extending its weekly advance to 38%. But beyond the price action, its chart is now flashing a Bearish Gartley harmonic pattern — a technical structure that can often precede further upside before the market reaches a reversal zone.
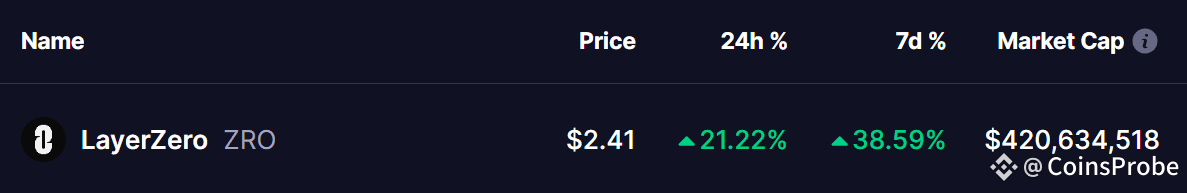
Source: Coinmarketcap
Harmonic Pattern Hints at Potential Bounce
On the daily timeframe, ZRO’s pattern begins at point X near $3.332, slides to point A, rallies to point B, and retraces to point C around $1.638. Since then, the token has staged a powerful rebound, now trading near $2.41 — firmly above its 100-day moving average at $2.18, which has flipped into key support.
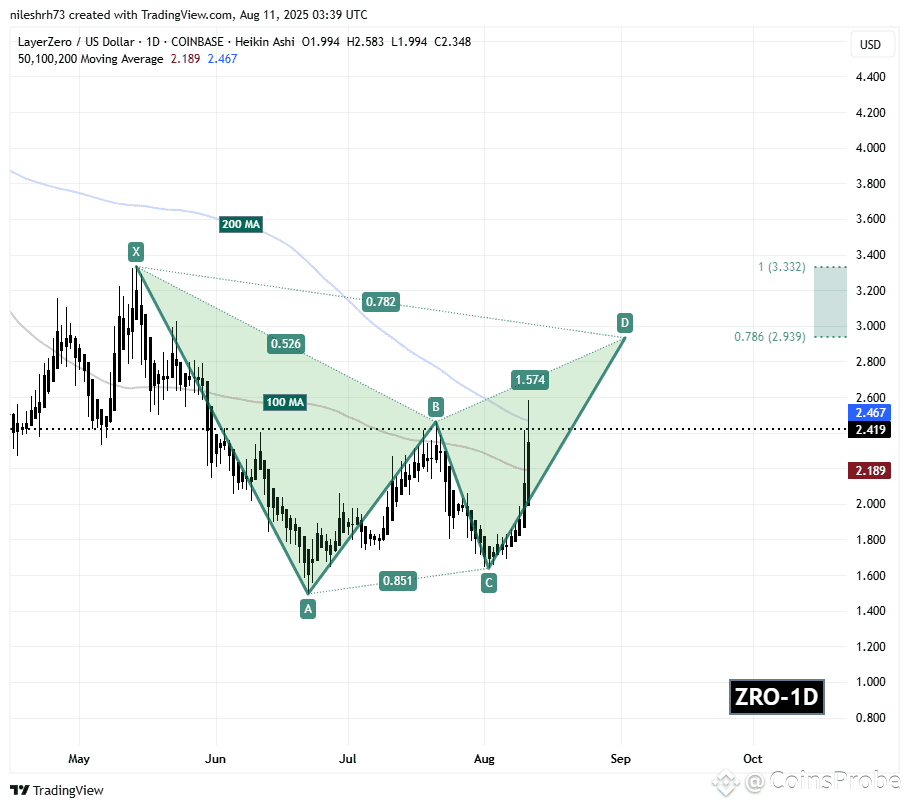
LayerZero (ZRO) Daily Chart/Coinsprobe (Source: Tradingview)
The immediate test lies at the 200-day moving average ($2.46), a crucial resistance level that has capped recent attempts to push higher.
What’s Next for ZRO?
If ZRO can break above the 200-day MA with strong momentum, it could advance toward its Potential Reversal Zone (PRZ) between $2.93 and $3.33. These levels align with the 0.786 and 1.0 Fibonacci extensions, which often mark the completion point for Bearish Gartley patterns. From current prices, that represents up to a 38% upside.
However, failure to clear the 200-day MA could invite a pullback toward the 100-day MA ($2.18) before bulls attempt another leg higher.
Disclaimer: This article is for informational purposes only and does not constitute financial advice. Always perform your own research before investing in cryptocurrencies.


