In the turbulent waves of the financial market, Bollinger Bands are like a magical 'rubber band' that can stretch and change, cleverly capturing the patterns of price fluctuations and pointing investors in the right direction. Today, let’s step into the wonderful world of Bollinger Bands together.
1. What are Bollinger Bands?
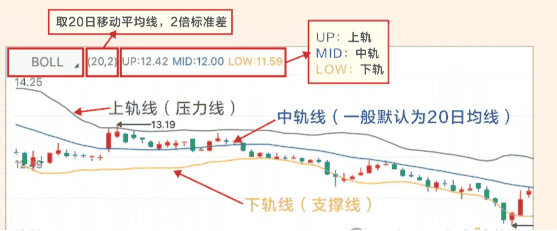
Bollinger Bands consist of three lines: the upper band, middle band, and lower band. You can think of it as a 'home' for prices. The middle band is like the center of the home, representing the main trend direction of the price; it is a smooth curve calculated based on the average price over a certain period of time. The upper and lower bands act like the roof and floor of the home, maintaining a certain distance from the middle band, which automatically adjusts based on the size of price fluctuations, just like a rubber band. When price fluctuations are large, the rubber band stretches, and the Bollinger Bands widen; when price fluctuations are small, the rubber band contracts, and the Bollinger Bands narrow.
2. The function of Bollinger Bands
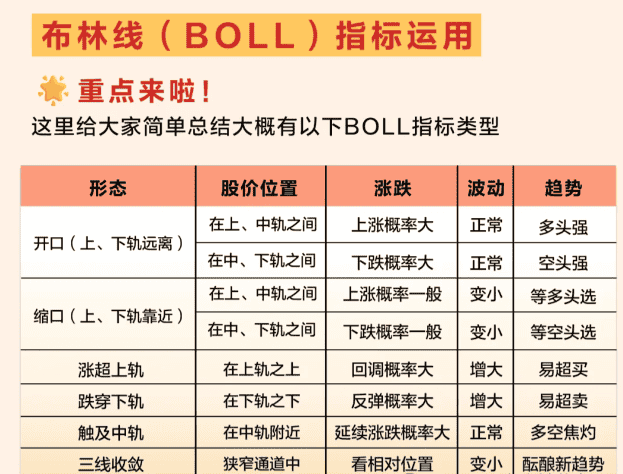
The main function of Bollinger Bands is to help us understand the range and trend of price fluctuations. Prices typically fluctuate between the upper and lower bands of the Bollinger Bands. If the price is close to the upper band, it indicates that the price may have risen quite high, like a ball thrown near the roof, ready to fall at any time; at this point, investors need to be cautious of the risk of a price correction. Conversely, if the price is close to the lower band, it is like the ball is about to hit the floor, and may rebound at any moment, making it a good buying opportunity.
3. Practical application
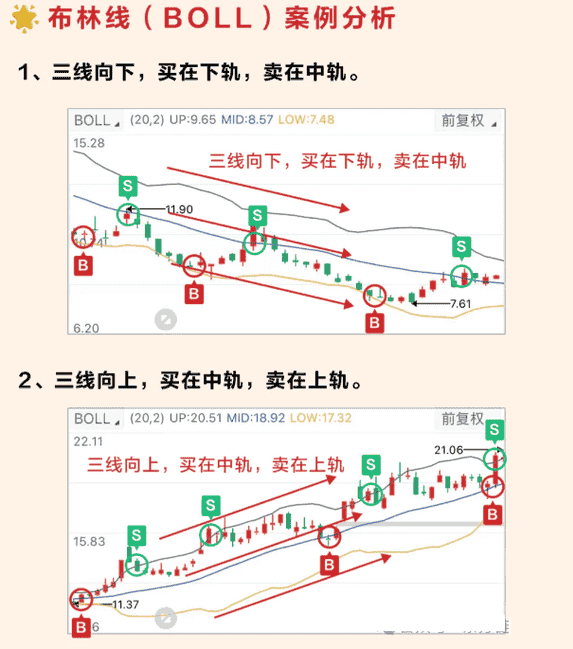
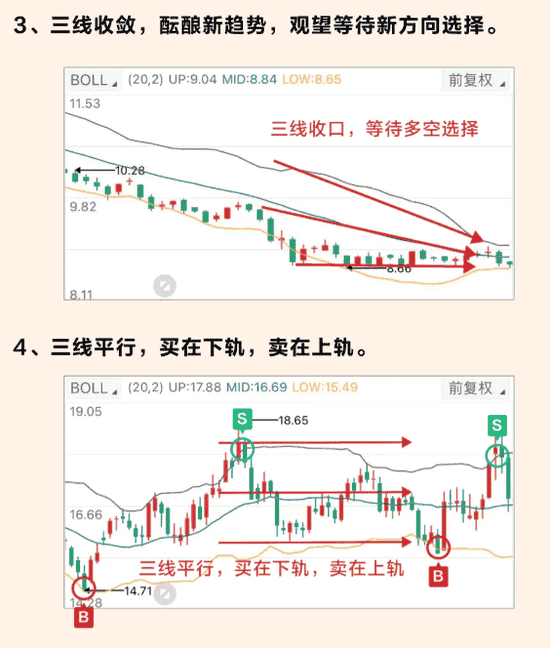
In practical operations, Bollinger Bands can help us make buying and selling decisions. For example, when the price rebounds from the lower band and crosses the middle band, this may be a buying signal, indicating that the price is starting to strengthen; conversely, when the price falls from the upper band and crosses the middle band, this may be a selling signal, indicating that the price is starting to weaken. However, it is important to note that Bollinger Bands are not foolproof; they need to be used in conjunction with other analytical tools to more accurately judge market trends.
In summary, the Bollinger Bands are a guiding light for investors navigating the financial ocean, revealing the patterns of price fluctuations in a simple and intuitive way, helping us find suitable buying and selling opportunities amidst the market's ups and downs, and achieving stable investment.