Introduction:
In trading, identifying the general market trend is like reading the wind before setting sail. A clear understanding of market trends allows traders to align their strategies with the dominant direction of price movement, increasing the probability of success.
Today, we’ll explore the three main types of market trends, how to identify them, and how to use them in your trading strategy.
1. What is a Market Trend?:
A market trend is the overall direction in which an asset’s price is moving over a specific period of time.
Trends can be:
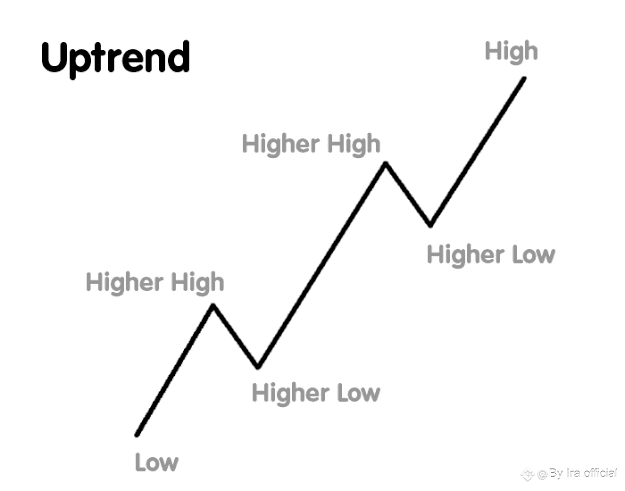
Uptrend: Prices are generally moving higher.
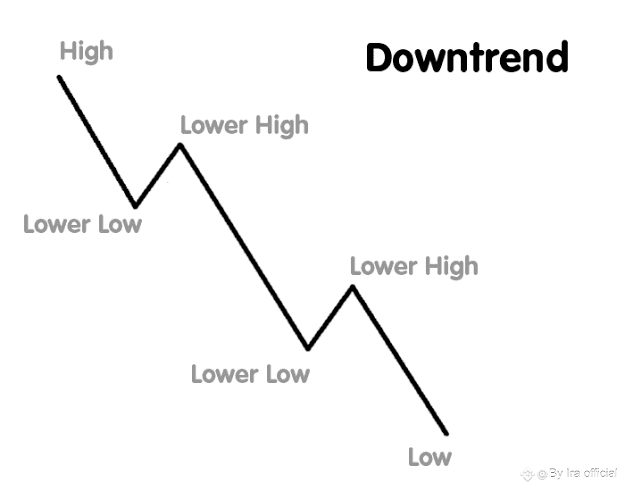
Downtrend: Prices are generally moving lower.
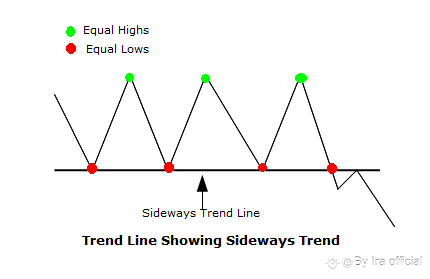
Sideways (Range-bound): Prices are moving within a horizontal range without a clear upward or downward direction.
2. The Three Types of Trends:
A. Uptrend:
An uptrend is characterized by a series of higher highs and higher lows.
Example: Bitcoin moving from $60,000 to $65,000 to $70,000 over several weeks.
Traders often look to “buy the dips” in an uptrend.
B. Downtrend:
A downtrend is characterized by a series of lower highs and lower lows.
Example: Ethereum dropping from $4,000 to $3,800 to $3,500.
Traders often short or avoid long positions during a strong downtrend.
C. Sideways Trend:
Also called range-bound movement. Prices oscillate between a support and resistance level.
Example: XRP moving between $0.50 and $0.55 for two months.
Traders may look for breakouts or trade within the range.
3. How to Identify a Trend:
Price Structure: Observe if highs and lows are progressively rising or falling.
Trendlines: Drawing lines connecting key highs or lows to visualize the direction.
Moving Averages: A rising 50-day moving average indicates an uptrend, while a falling one suggests a downtrend.
Volume Analysis: Healthy trends are often supported by increasing volume in the direction of the trend.
4. Using Trends in Trading Strategies:
Uptrend Strategy: Buy during pullbacks near support levels. Use trailing stops to protect profits.
Downtrend Strategy: Short during rallies towards resistance levels.
Sideways Strategy: Trade bounces between support and resistance until a breakout occurs.
5. Real Examples from the Crypto Market (2025):
Uptrend Example: Bitcoin in early August 2025 surged from $59,500 to $65,200 driven by institutional buying.
Downtrend Example: Solana declined from $180 to $150 after a major hack on one of its DeFi platforms.
Sideways Example: Cardano stayed between $0.32 and $0.35 for six weeks due to low market activity.
6. Key Takeaways:
Always trade in the direction of the prevailing trend.
Use multiple indicators to confirm the trend.
Avoid forcing trades against strong trends; patience is key.
Trends can last for days, weeks, or even months—adapt accordingly.
Conclusion:
Market trends are the heartbeat of trading. By recognizing whether the market is in an uptrend, downtrend, or sideways phase, you can make informed decisions and manage your risk effectively. Remember: “The trend is your friend — until it ends.”
🔔like and follow if you beneficial 🙏❤
#lessonlearned #LearnFromMistakes #LearnCrypto #Binance #BinanceSquareFamily


