

AAVE’s SuperTrend buy signal at $160–$170 resembles past 867% and 551% rallies.
Clearing $320 could target $340–$360, while support is at $260 and $240.
RSI at 59.70 and bullish MACD crossover signal strengthening buyer momentum.
AAVE has entered a bullish phase as the SuperTrend indicator changed to a buy signal, according to analyst Ali. Historical data shows that similar setups in late 2020 and mid 2023 led to substantial rallies.
In 2020–2021, a buy signal emerged near $80, followed by a surge to around $680, a gain of over 667%. Another buy call appeared in mid 2023 around $60–$65, with prices surging by nearly $400 for a 551% rise. This fresh signal in 2025 appeared at the $160–$170 range.
Price Action and Resistance Zone
The current price movement shows a high of $311.45 and a low of $303.33, with gains of 0.03% on the day. Price is approaching the $320 level, tested in mid July before a pullback occurred.
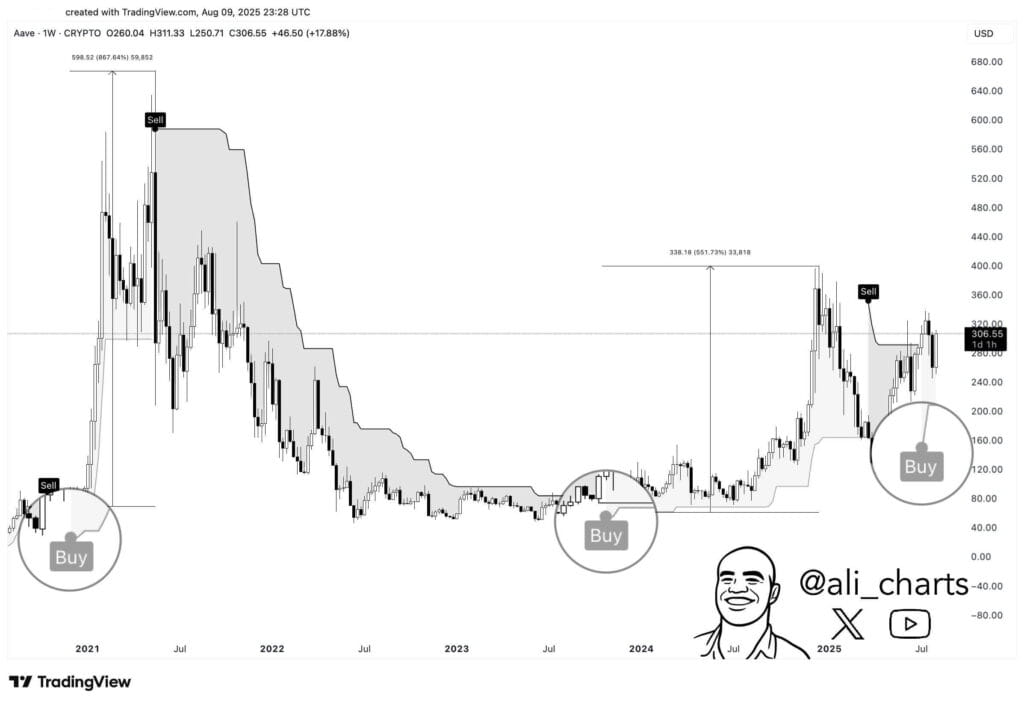 Aave 1-week price chart, Source: Ali on X
Support is at $260, the early August swing low, and deeper support is near $240. The latest rally comes after price broke above the shaded volatility band on the chart, historically aligning with bullish momentum phases.
Momentum Indicators Strengthen With Buyer Activity
Volume has risen to 43.71K, slightly above recent averages, indicating renewed interest from the market. RSI is at 59.70, recovering from late July oversold reading near 30–35 and moving toward bullish level.
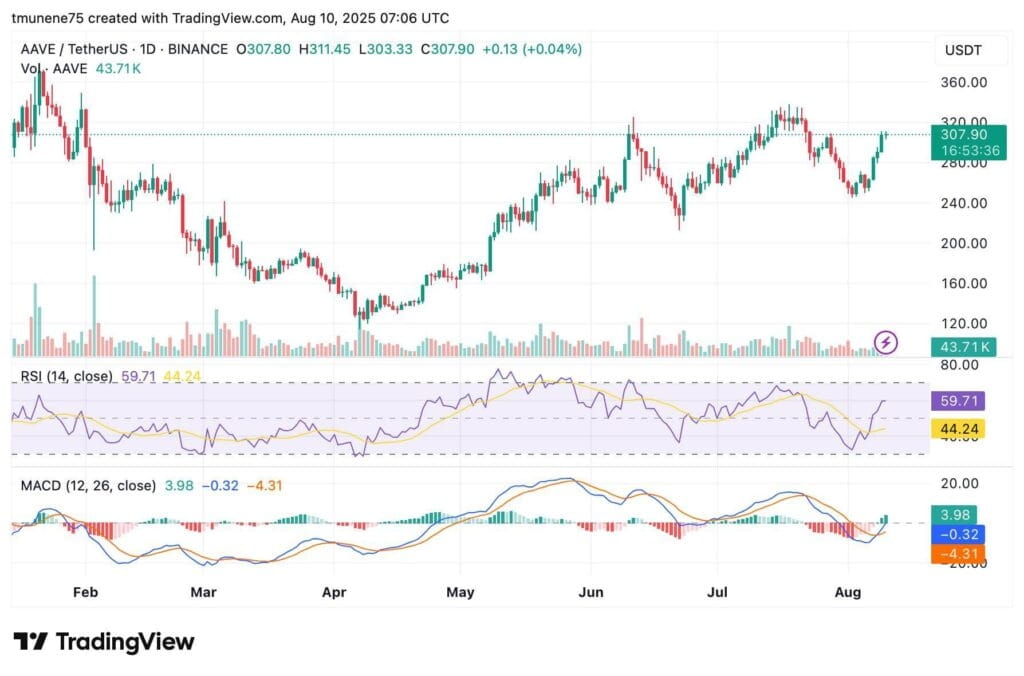 AAVE/USDT 1-day price chart, Source: TradingView
The RSI is below 70, with potential before overbought levels are reached. The MACD line at 3.98 is above the signal line at -0.33, with a positive histogram, indicating a recent bullish crossover. This supported by climbing prices and increased volume, points to growing buyer control in the market.
Key Levels for the Short Term
If the price closes above $320 and maintains that level, the next upside target could be between $340 and $360, aligning with previous highs. Failure to clear $320 may lead to a pullback toward $280 or even $260, especially if buying volume fades.
Strong support is in the $160–$170 range, where the most recent buy signal originated. The price sustained break above the shaded indicator zone further supports the short term bullish case while also marking levels the market is watching.
The post AAVE Flashes Rare Buy Signal After Past 867% and 551% Surges, Says Analyst appears on Crypto Front News. Visit our website to read more interesting articles about cryptocurrency, blockchain technology, and digital assets.
