
Dogecoin is showing strong signs of market recovery, with recent price movements and technical indicators suggesting an upcoming bullish trend. According to technical analysis, Dogecoin's recent price behavior has opened a path towards the $1 level, a path that is becoming increasingly clearer if certain conditions are met.
Notably, the technical analysis by cryptocurrency analyst MMBTtrader on the TradingView platform has outlined a bullish setup forming after Dogecoin's price broke out of the long-term downtrend channel on the 3-day candlestick chart.
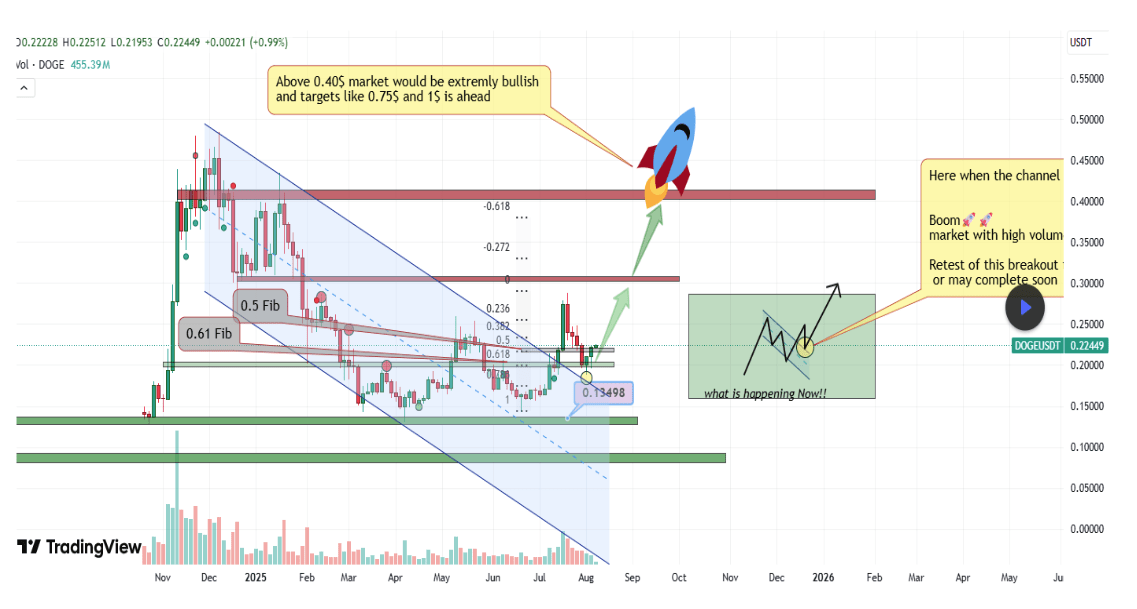
The Downtrend Channel Has Been Broken And Retested Successfully
As shown in the 3-day candlestick chart below, initially shared by MMBTtrader, Dogecoin broke above the descending parallel channel on July 15. This breakout is significant as it represents a shift in market structure from continuous selling pressure to a stage of expansion from the channel that has suppressed price volatility since late 2024.
However, after breaking out of this channel in mid-July, Dogecoin began a correction on July 21, causing the price to continue dropping towards the upper trendline of the descending channel. According to the analyst's observations, this movement allowed Dogecoin to successfully retest the breakout area, a move he sees as confirmation that the bulls have regained control.
Notably, the Fibonacci retracement level of 0.61 appears as an important pivot point, where Dogecoin's price action finally found strong support. This support level is around the low price of $0.188 on August 2, after which it bounced and closed three bullish 3-day candlesticks since then. MMBTtrader noted these candlesticks as a good signal, indicating that excessively leveraged buying positions have been resolved, and Dogecoin's price action is now in a more stable state for a strong bullish move.
Dogecoin Will Reach $1 When This Happens
Now, as Dogecoin seems to have bounced back after retesting the downtrend line, the analyst has highlighted several targets on the way to $1. The first price target is $0.32, aligning with the Fibonacci resistance level of 0.236 and serving as a strong support level in December 2024. Therefore, breaking this level would be a decisive breakthrough at the support level turning into resistance.
One of the most important observations in the analysis is the resistance level at $0.40, marked on the chart by a prominent red horizontal zone. According to MMBTtrader, a strong breakout above $0.40 would put Dogecoin into a phase he calls "extremely bullish."
Breaking above the $0.40 resistance will open up bullish potential and push Dogecoin into a new price range, surpassing the current all-time high of $0.73. Specifically, the price is forecasted to rise to $0.75 and reach the highly desired price of $1.
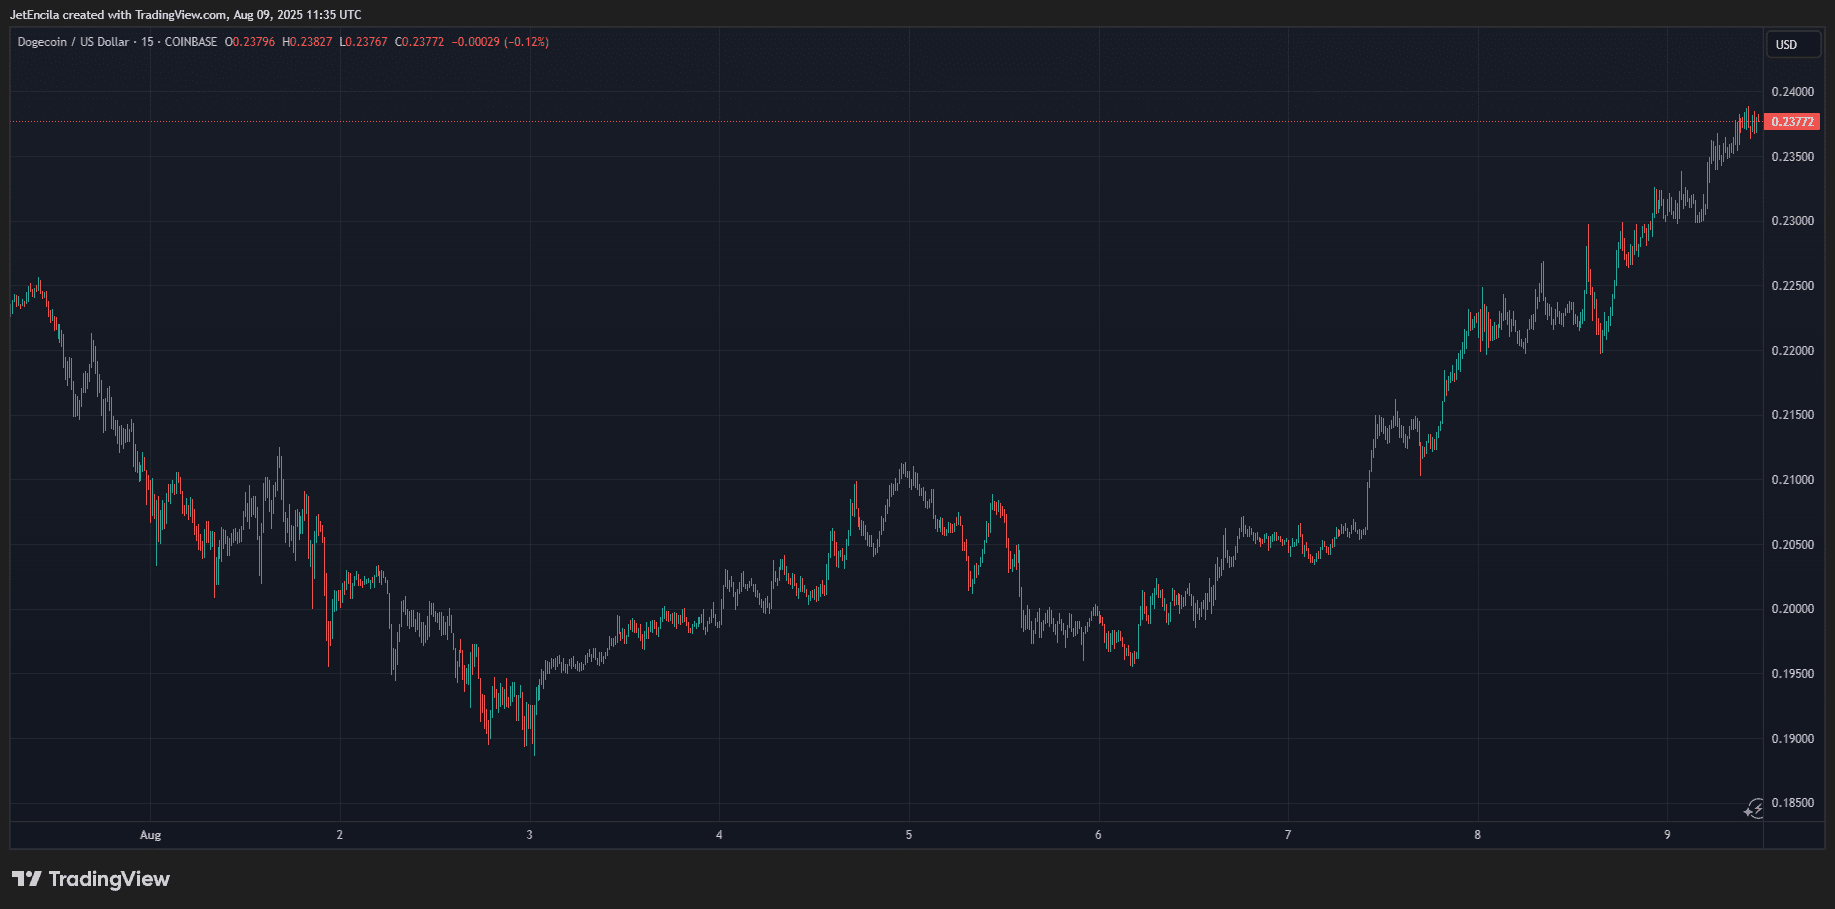
At the time of writing, Dogecoin is trading at $0.2355, up 6.2% and 17.7% respectively in the past 24 hours and the past seven days. The most crucial aspect for the current bullish momentum is maintaining above the Fibonacci 0.5 level at $0.216.