
Date: Sat, Aug 09, 2025 | 08:25 AM GMT
The cryptocurrency market is flashing bullish mode as Ethereum (ETH) crossed the $4150 mark for the first time since 2021. This 6% daily jump has sparked a broader rally, lifting major altcoins — including Kaspa (KAS).
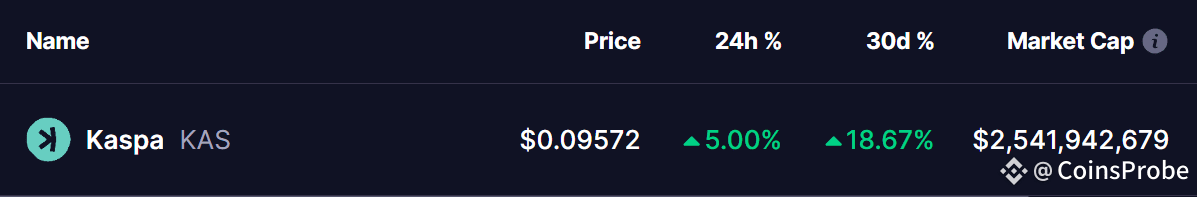
$KAS has turned green with a solid 5% jump, extending its monthly gains to 18%. More importantly, its price chart is now showing a familiar harmonic setup that may hint at the next move.
Source: Coinmarketcap
Harmonic Pattern Hints at Potential Bounce
On the daily timeframe, KAS is carving out a Bearish ABCD harmonic pattern — a classic structure that, despite its name, often involves a strong bullish CD leg before price reaches the potential reversal zone (PRZ).
The move began with a rally from point A near $0.0738 to point B, followed by a pullback to point C around $0.0800. From there, bulls regained control, and the price has now advanced to roughly $0.0958, confirming the CD leg is underway.
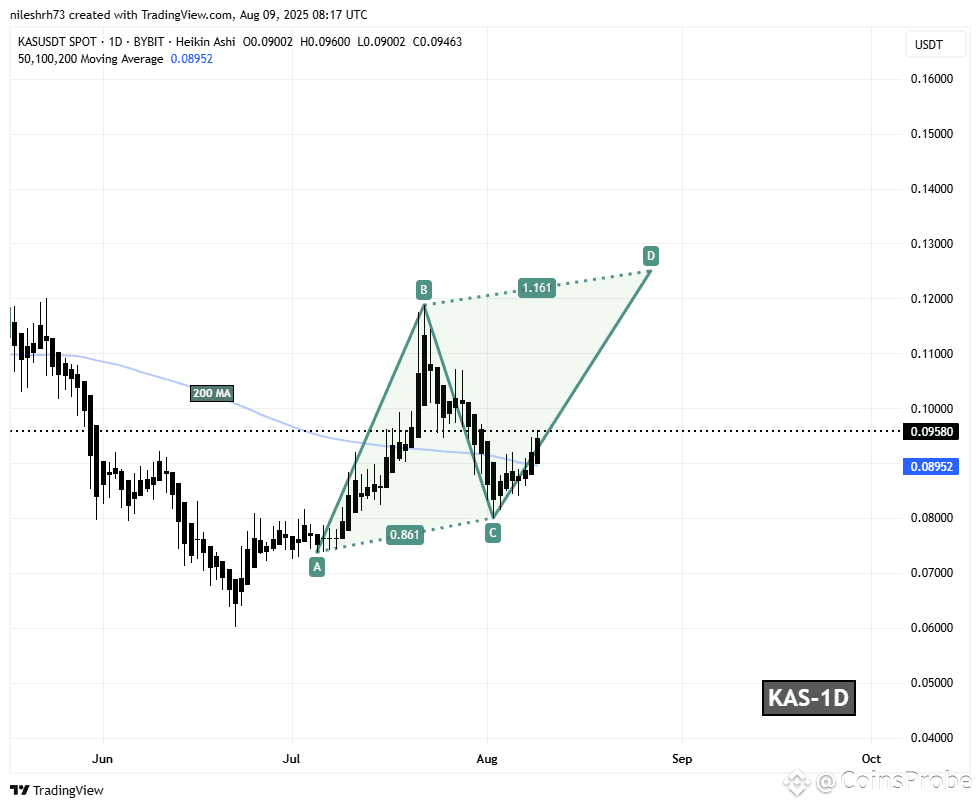
Kaspa (KAS) Daily Chart/Coinsprobe (Source: Tradingview)
Based on harmonic projections, the CD leg could stretch toward the 1.161 Fibonacci extension of the BC leg, pointing to a PRZ around $0.1250. If reached, this would translate to roughly a 30% gain from current levels.
What’s Next for KAS?
Momentum appears to be favoring the bulls. A sustained push toward the $0.1250 target would complete the ABCD pattern, though this zone could also attract profit-taking and act as a tough resistance level.
On the downside, the 200-day moving average, currently sitting near $0.0895, serves as an important support level. Holding above it would keep the bullish case intact, while a breakdown could trigger a deeper consolidation.
Disclaimer: This article is for informational purposes only and does not constitute financial advice. Always do your own research before making investment decisions.

