
In cryptocurrency trading, candlestick patterns are like a secret language between buyers 🟢 and sellers 🔴. Each candle tells a story of who was in control during a specific time frame — and knowing how to read them can help you avoid costly mistakes.
When buyers are in complete control ✅, you’ll see a large green candle 🟩 showing strong upward momentum from start to finish. A green candle with a long lower wick 🟩⬇️ means sellers pushed prices down early, but buyers fought back and closed higher — a strong sign of resilience.
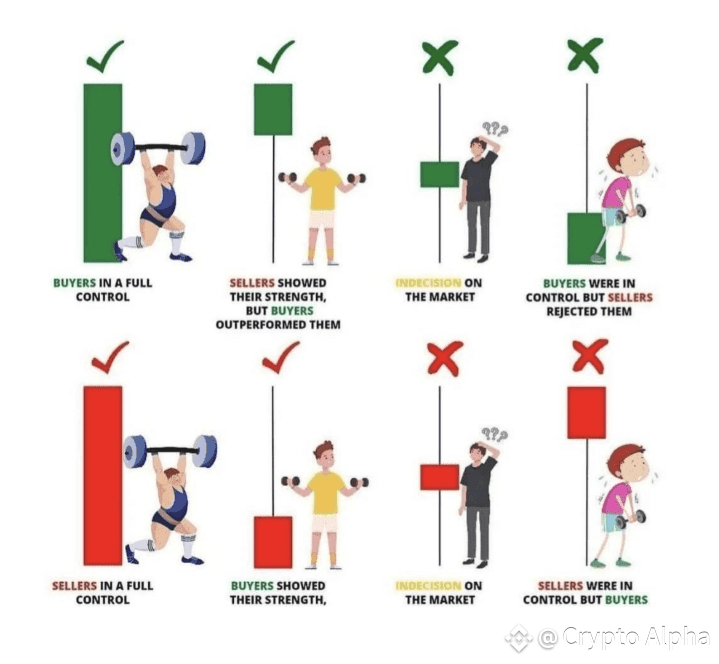
A doji candle ➕ indicates market indecision ❌ — buyers and sellers were evenly matched, resulting in little to no net movement. Another important pattern is a green candle with a long upper wick 🟩⬆️, showing buyers pushed prices higher, but sellers rejected the move before the close.
On the bearish side, a large red candle 🟥 signals sellers are in full control ✅, driving prices sharply lower. A red candle with a long lower wick 🟥⬇️ suggests sellers dominated early, but buyers made a comeback before closing. Small-bodied candles with wicks on both sides 🟧 show indecision, where neither side clearly wins. Finally, a red candle with a long lower wick 🟥↘️ means sellers pushed hard, but buyers stepped in to recover lost ground.
💡 Key Takeaways:
✔️ Long candles = clear strength from buyers or sellers
✔️ Wicks = rejection or retracement
❌ Doji = market indecision
By mastering these candlestick signals, you can read market sentiment 🧠, anticipate possible price moves, and make smarter trading decisions in the fast-moving world of crypto. 🚀