
A new chart shared on X by the anonymous technician Charting Guy is stirring rumors about Dogecoin, suggesting that the most famous meme coin with social media appeal may be gearing up for a price surge towards the upper boundary of a long-standing uptrend near $1.60.
Will Dogecoin Surge Above $1?
The daily chart of the analyst (BINANCE: DOGEUSDT) portrays price action over nearly two years in a wide, rising purple-red wedge pattern, with support levels rising from about $0.06 at the end of 2023 to the current $0.17, and the projected resistance expected to be $1.10–$1.60 in the coming months. At the time of writing, DOGE is trading at $0.2219, up 8.7% on the day, after just breaking through the internal trend line of the wedge pattern, which has been the pivot point for all bullish movements until mid-July 2025.
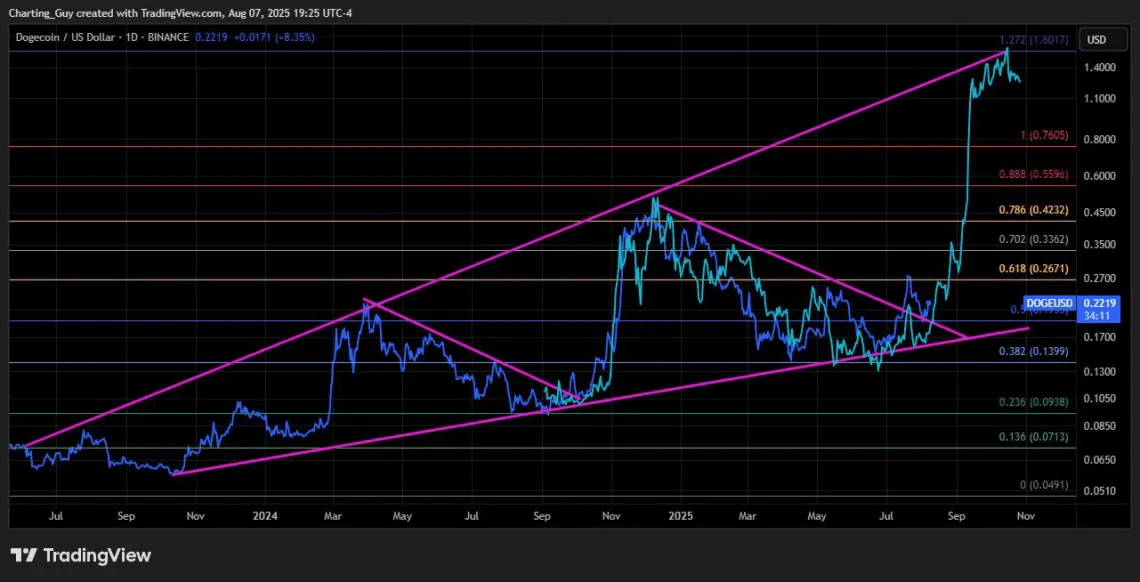
A cluster of Fibonacci retracement and extension levels anchored at the swing low of the chart at $0.0491 and the swing high at $0.7605 defines the path traders are monitoring. The token has reclaimed the 0.382 retracement at $0.1399 and the psychological support level of $0.20, and is currently oscillating above the $0.50 region at $0.1933 - before the more technically significant golden ratio of $0.618 ($0.2671). Above that, Fibonacci-derived resistance levels stack up at $0.702 ($0.3362), $0.786 ($0.4232), and $0.888 ($0.5596), with the complete retracement at $0.7605 and the 1.272 extension delineated at $1.6017 - exactly where the upper boundary of the wedge model converges according to the analyst's forecast.
What makes this scenario appealing is the cyan overlay on the chart - a fractal replica of the DOGE explosion from late 2024 - has been converted into the current structure. In the previous episode, this coin soared 439% after the price hit the rising wedge support level, broke through the downward resistance line, retested the support level, and accelerated straight to the upper boundary.
The overlay implies that a similar sequence has begun to unfold: DOGE retested the wedge support level at the end of June, broke the internal trend line in mid-July, and successfully retested it this week - if the fractal continues to rhyme - could begin a dizzying sprint ending where the 1.272 extension meets the wedge peak just north of $1.60.
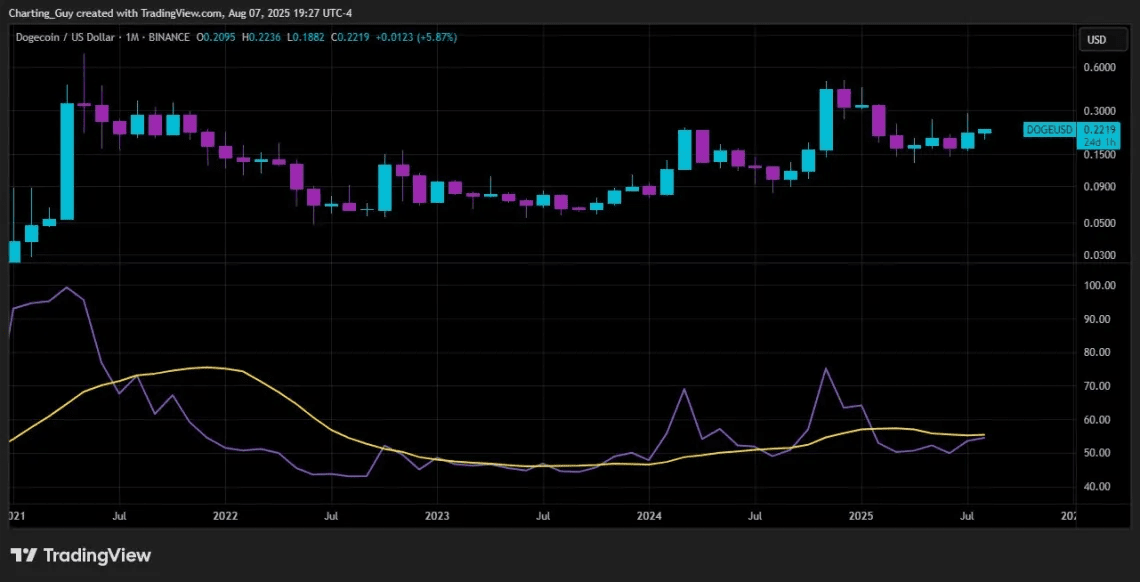
The monthly outlook further reinforces the bullish trend. Charting Guy points out that the Relative Strength Index (RSI) is on the verge of crossing its own moving average in the 50-55 range. The last time this crossover occurred, in early 2024, the price surged 439% as mentioned above. Although momentum has cooled since that peak, the oscillator has never dipped into the oversold territory, indicating, in classical technical terms, that DOGE is bottoming rather than topping.
Skeptics will note that the same wedge pattern has twice rejected bullish attempts below $0.50, and the memecoin remains below all high-timeframe supply levels up to $0.76. However, the chart shape allows the price to quickly adjust if buyers overcome the resistance at $0.27–$0.34: the "empty space" between the Fibonacci levels of 0.702 and 0.888 coincides with the steepest part of the wedge model.
Currently, traders have a key factor to watch – the intrinsic purple-red downtrend that DOGE has just tested from above. A decisive weekly close on this line, along with increased trading volume, will officially confirm the breakout scenario. Failing to hold above $0.20 will invalidate the fractal and shift focus back to the wedge support level, which is currently near $0.17.
Whether history repeats exactly like fractal projects remains to be seen, but the structural logic on the chart is clear: as long as Dogecoin respects its four-year rising bottom, the path of least resistance will continue to tilt higher – and the upper boundary of that structure will end at $1.60. The coming weeks will reveal whether this meme asset can turn that technical aspiration into reality in the market.
