$BTC is currently consolidating above $116K, after pulling back from its $123K all-time high. While the broader uptrend is still intact, there's increasing uncertainty in the charts — and BTC’s next big move could be right around the corner.
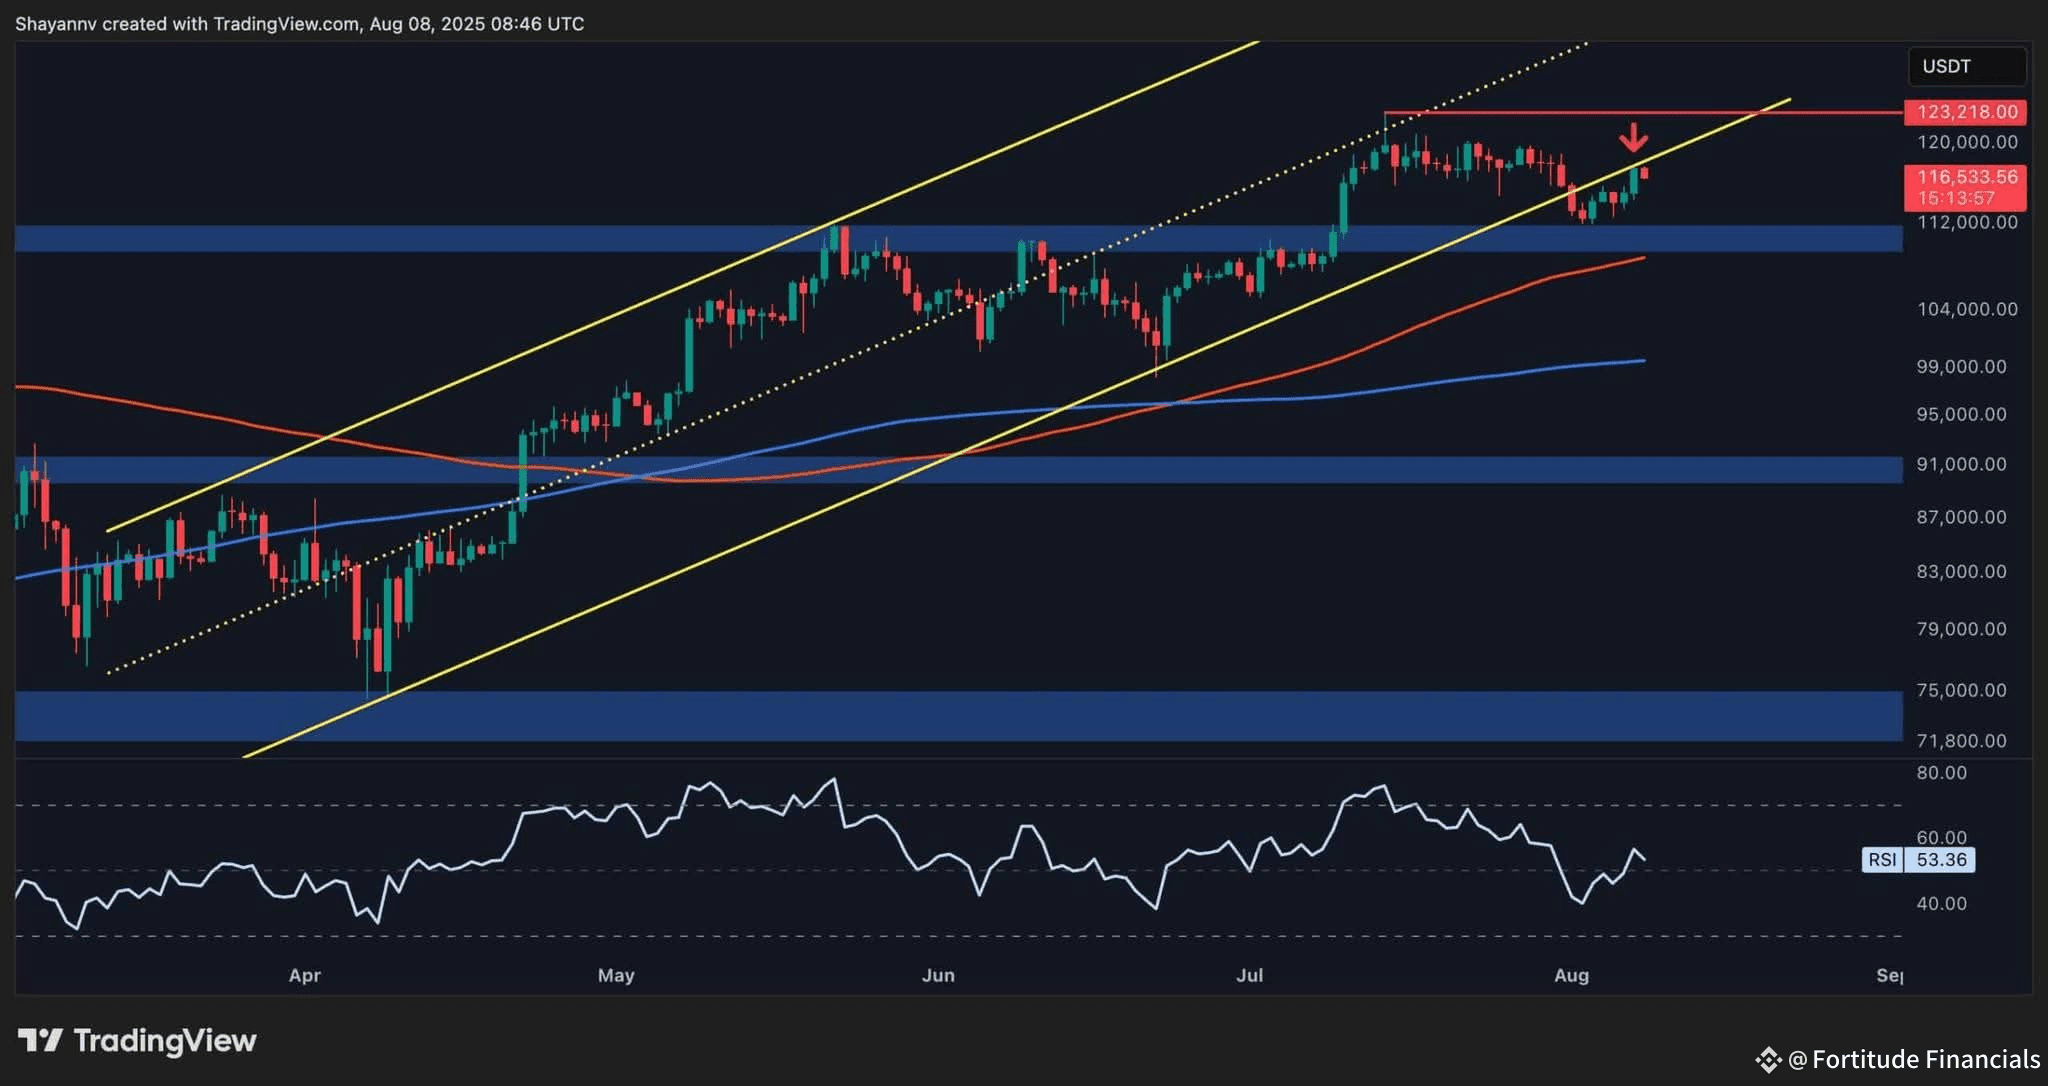
🔍 Daily Chart Highlights:
•BTC has broken below its long-standing ascending channel.
•Holding just above the 100-day MA (~$110K) — a crucial support zone.
•RSI near 51 = neutral sentiment.
•If $110K fails, eyes are on the $100K support and 200-day MA.
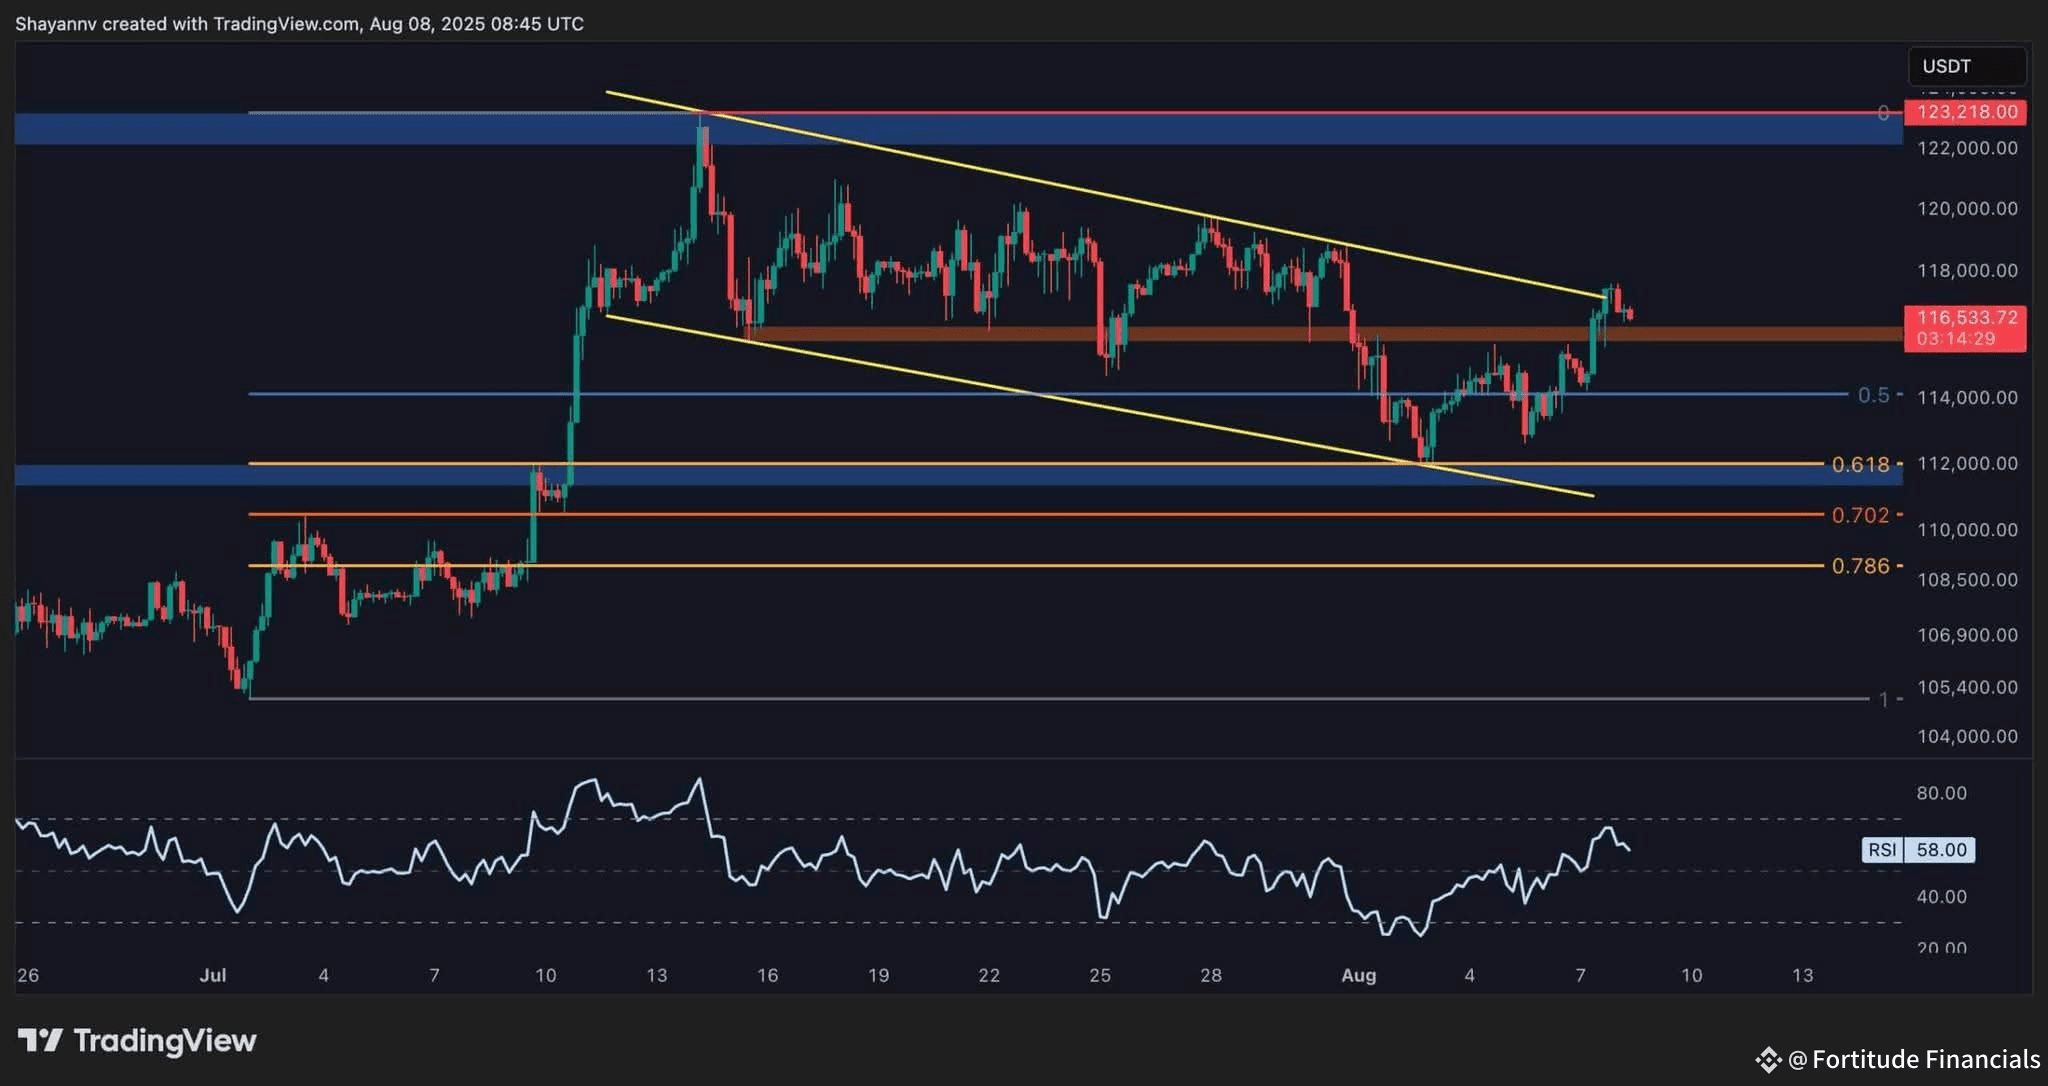
📉 4-Hour Chart:
•BTC is trapped in a descending channel, but…
•It’s showing signs of a breakout after reclaiming the $116K resistance.
•RSI > 50 ➜ bullish shift detected.
•Rebound from 50% Fibonacci suggests potential for a run back toward $123K ATH.
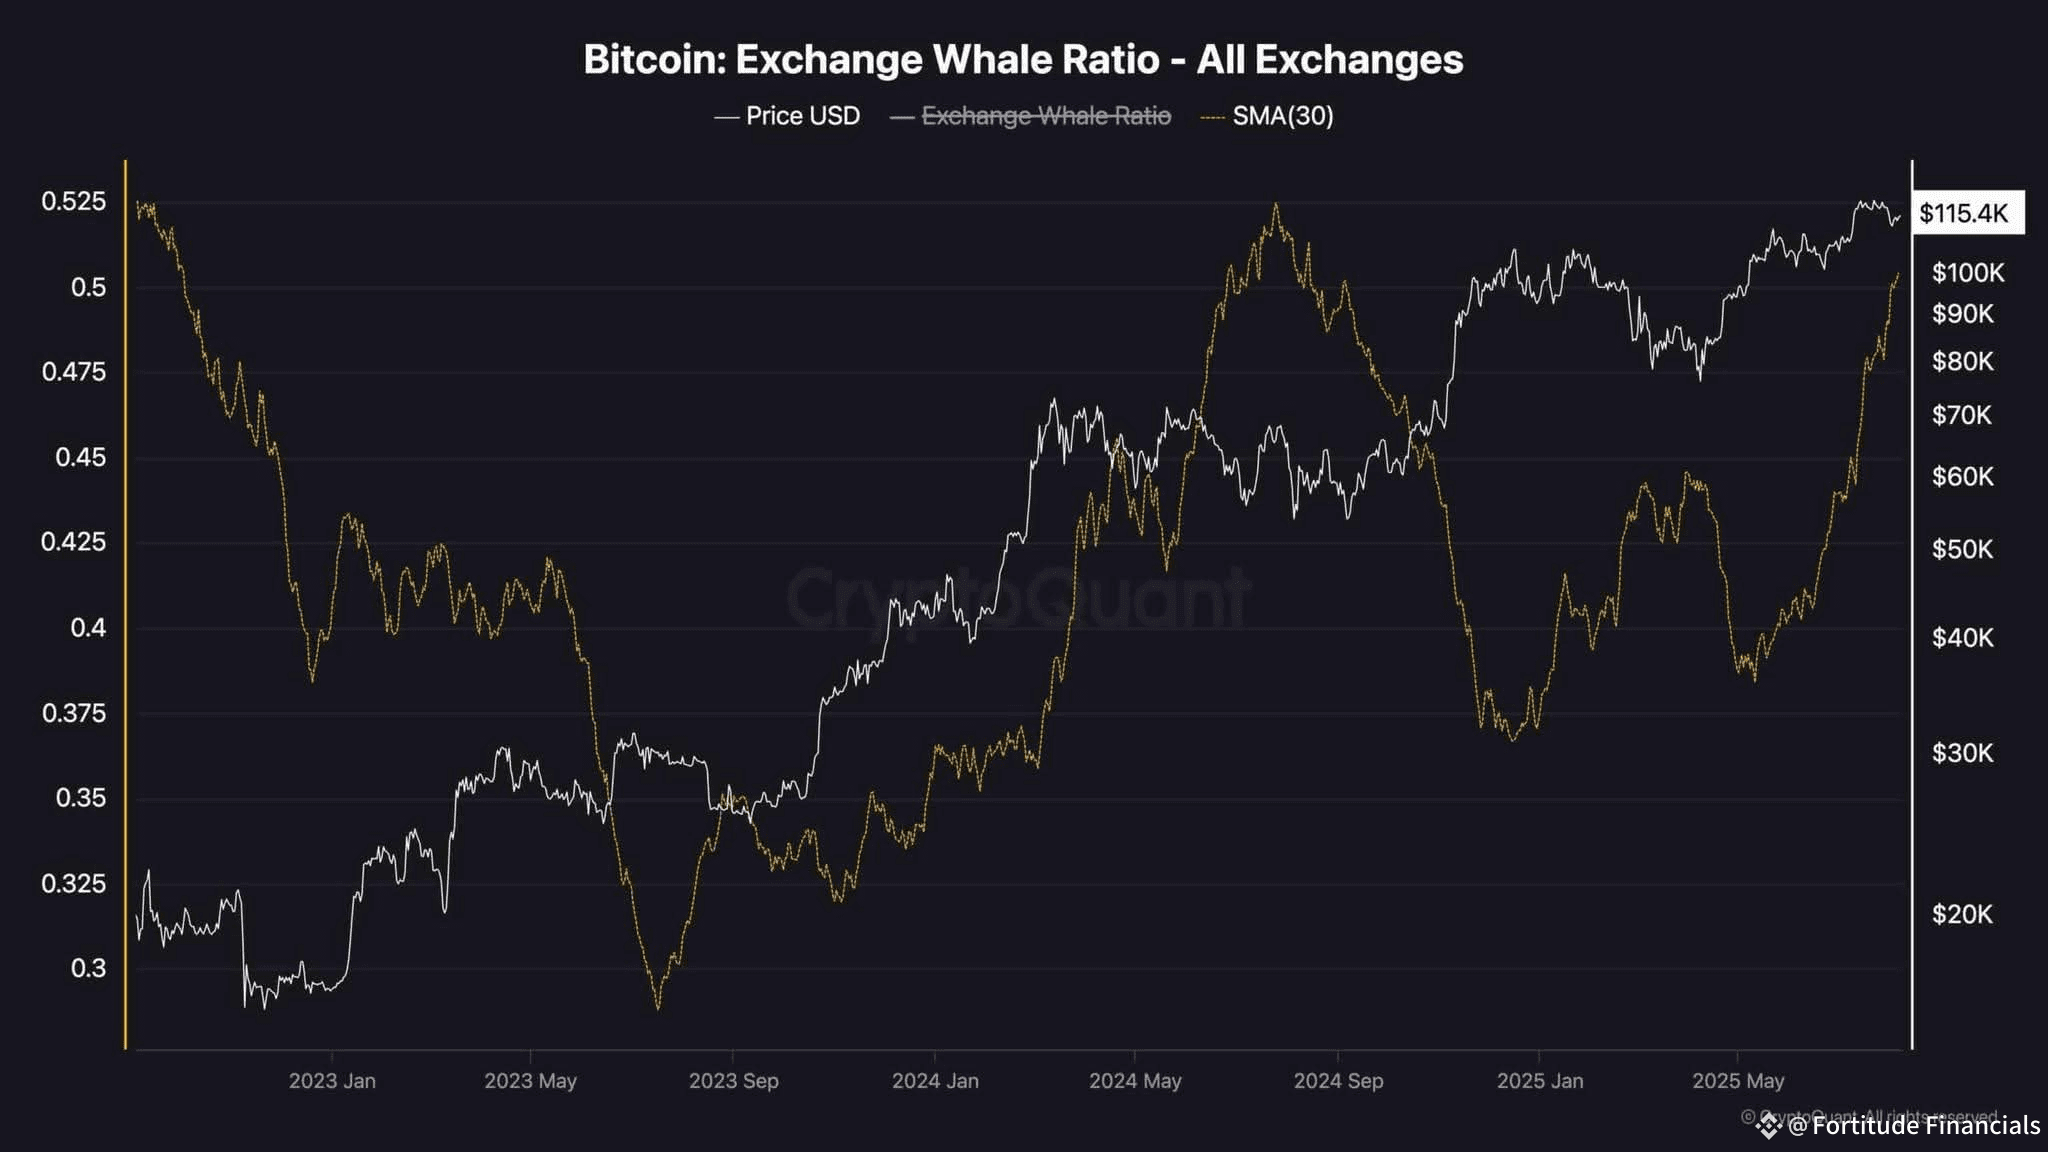
🐋 On-chain: Whale Watch
The Exchange Whale Ratio is flashing red — reaching its highest since 2023. Historically, this hints at possible profit-taking or distribution.
⏳ Summary:
A break above $116K could trigger another leg up, while a failure to hold $110K opens the door to $100K. Eyes on whale moves and key support levels in the coming days.
#bitcoin #BTC走势分析 #CryptoAnalysis #cryptotrading #CryptoMarket