Want to know the one thing that separates pro traders from everyone else? It’s not a secret indicator or a magic formula. It’s the ability to see things on a chart that others can't.
Every single price movement in the crypto market leaves a clue. If you can read these clues, you’ll know where the market is going before it gets there.
These clues are called chart patterns, and they’re a visual map of the battle between buyers and sellers. Learning to spot them is the single most powerful edge a trader can have.
Here are 9 chart patterns that can turn you from a beginner to a pro.
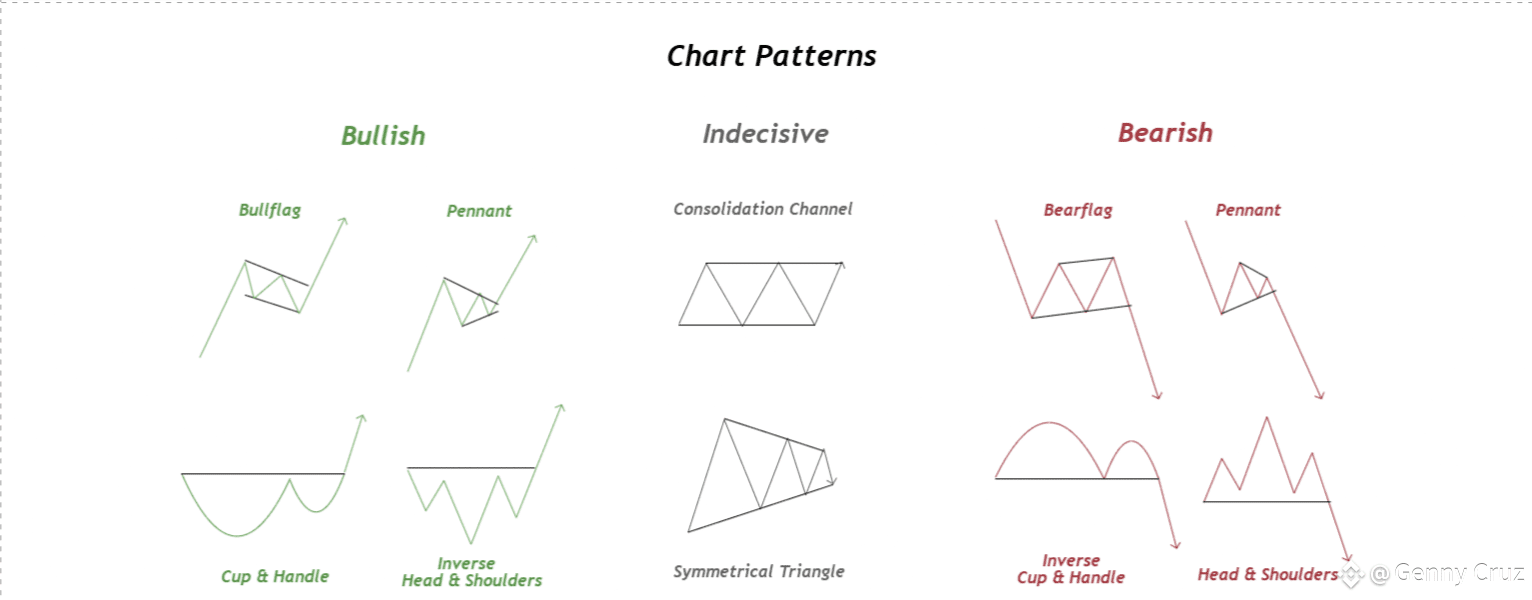
1. Bullish Patterns
These are signs that the market is about to push higher.
* Bull Flag: A steep rally followed by a short, downward channel. The market is just taking a break before continuing to climb.
* Pennant (Bullish): After a big jump, the price squeezes into a small triangle before bursting out in the same upward direction.
* Cup & Handle: The price forms a rounded bottom (the cup), pulls back slightly (the handle), and then breaks out to the upside. This is a classic sign of a strong move coming.
* Inverse Head & Shoulders: The price creates three troughs, with the middle one being the deepest. When it breaks above the "neckline," it's a clear signal that a downtrend is reversing.
2. Indecisive Patterns
The market is taking a pause. The direction is unknown until a breakout happens.
* Consolidation Channel: The price moves sideways between two parallel lines. Think of this as the market refueling for its next move.
* Symmetrical Triangle: The price gets tighter and tighter between converging trendlines. A breakout can happen either way, so you have to wait for the market to pick a side.
3. Bearish Patterns
These patterns warn that selling pressure is taking over.
* Bear Flag: A steep drop followed by a small, upward channel. This usually means another drop is on the way.
* Pennant (Bearish): After a sharp fall, the price consolidates into a small triangle before breaking to the downside.
* Inverse Cup & Handle: A rounded top forms, followed by a slight bounce up (the handle) before breaking down. This often signals a reversal from a bullish trend.
* Head & Shoulders: The price forms three peaks, with the middle one being the highest. A break below the "neckline" signals a potential reversal to a bearish trend.
Why Chart Patterns Matter
Chart patterns aren't magic. They're a window into what traders are thinking and feeling. They help you:
* Find high-probability trading opportunities
* Enter and exit trades at the perfect time
* Make logical, not emotional, decisions
The most important thing to remember? Always wait for confirmation. A pattern isn't a guarantee. Wait for the breakout or breakdown to happen before you jump in.
💡Pro Tip: Save this post and use it as a cheat sheet. The more you see these patterns in the wild, the faster you’ll spot opportunities that everyone else misses.