I know an elder who entered the coin circle with 100,000 yuan and currently has a market value of 42 million. He once said a sentence that enlightened me. He said, 'The coin market is like a crowd of people; you just need to control your emotions, and this market becomes an ATM!'
In the coin circle, your trading strategy is your 'secret weapon.' The following mnemonics are the crystallization of practical experience; be sure to save them!
Entry Section: Test the water in the coin circle, prepare to proceed; enter steadily, rejecting impulsiveness.
Sideways Trading: Buying heavily at low levels during sideways movement is appropriate; selling decisively during high levels is crucial.
Fluctuation Section: Sell at highs, enter quickly at dips; observe during sideways movement and reduce trading. Sideways means using sideways to replace falling; hold tight, and a rally may come in the next second; during a rapid rise, beware of a sharp drop, ready to secure profits at any moment; a gradual decline is a good time to gradually average down.
Timing of Buying and Selling: Do not sell on highs; do not buy on dips; do not trade during sideways movement. Buy on bearish candles, sell on bullish candles; reverse operations can stand out. Buy in a significant drop in the morning, sell in a significant rise in the morning; do not chase highs in the afternoon's rise, buy in the next day after a drop in the afternoon; do not cut losses in a significant drop in the morning; when there's no rise or fall, take a rest; average down to seek break-even; excessive greed is unacceptable.
Risk Awareness Section: Calm surfaces can lead to high waves; there may be big waves ahead; after a significant rise, there must be a pullback, with K-lines showing a triangle for several days. In an upward trend, look for support; in a downward trend, look for resistance. Full-margin trading is a big taboo; acting alone is not feasible; face the unpredictable with restraint, seizing the timing for entry and exit.
Trading coins is essentially trading mindset; greed and fear are the greatest enemies; be cautious when chasing highs and cutting losses; a calm heart leads to ease.
In addition to the mnemonic, I have also organized several super practical trading methods, from which both novices and experienced players can benefit.
Oscillation Trading Method: Most market conditions are in a range-bound pattern; using high sell and low buy within the box is the basis for stable profits. Utilizing the BOLL indicator.
And box theory, combine technical indicators and charts to accurately identify resistance and support. Follow short-term trading principles and avoid greed.
Breakthrough Trading Method*: After a long period of consolidation, the market will choose a direction; entering after the change can yield quick profits. However, precise identification of the change is necessary.
Unidirectional Trend Trading Method*: After breaking through the market range, a unidirectional trend will form; trading in the direction of the trend is key to profit. Enter trades during pullbacks or rebounds, referring to candlesticks, moving averages, BOLL, trend lines, etc., and mastering their application will make you adept.
Resistance and Support Trading Method*: When the market encounters key resistance and support levels, it often faces obstacles or receives support, and entering trades at this time is a common strategy.
Use trend lines, moving averages, Bollinger Bands, parabolic indicators, etc., to accurately determine resistance and support levels.
Pullback Trading Method: After significant rises and falls, there will be a brief pullback or rebound; seize the opportunity for easy profits. Rely mainly on candlestick patterns for judgment, and good market feel can help you accurately grasp highs and lows.
Time-frame Trading Method: The morning and afternoon sessions have small fluctuations, suitable for conservative investors; although the time to profit is long, it benefits from easier market grasp; the evening and early morning sessions have large fluctuations, suitable for aggressive investors, enabling quick profits but with high difficulty, requiring strict technical and judgment abilities.
Pay attention to the homepage; you will surely gain something. Helping others is also helping oneself. I hope that regardless of how the market changes, we can keep walking together and be able to look back on the coin circle with a smile ten years later.

Trend Following Secrets: Lock in a 10x Opportunity Over Ten Years
Specializing in Long-term Trends Wealth Code:
Halving Cycle Layout: 180 days before Bitcoin's halving, pre-allocate BTC, BCH, and other halving coins, holding them until 30 days after the halving.
Leading Stock Recovery Law: When the leading currency in the market rises by 200%, prioritize choosing second-tier coins in the same sector that have risen less than 50%.
Technical Triple Verification: Weekly MACD golden cross + daily breakout of the box + hourly line volume bullish engulfing, forming a golden buying point.
Institution Holding Analysis: Glassnode data shows that when large addresses continue to increase holdings, combined with a surge in on-chain trading volume, it serves as a launch signal.
Bear Market Regular Investment Strategy: Invest 10% of the principal every month, choosing blue-chip coins like BTC, ETH, and achieve returns exceeding 300% after continuous investment for 12 months.
Risk Warning: The above strategies need to be adjusted according to real-time market conditions. Newbies are advised to first verify with a simulated account, and the loss for a single trade should not exceed 2% of total funds. The market is risky; invest cautiously.
Welcome to follow the homepage; you can learn and communicate with real trading, and also have a clear direction and strategy for the market. No matter what style the market is, knowing in advance allows for better mastery!
1. Introduction
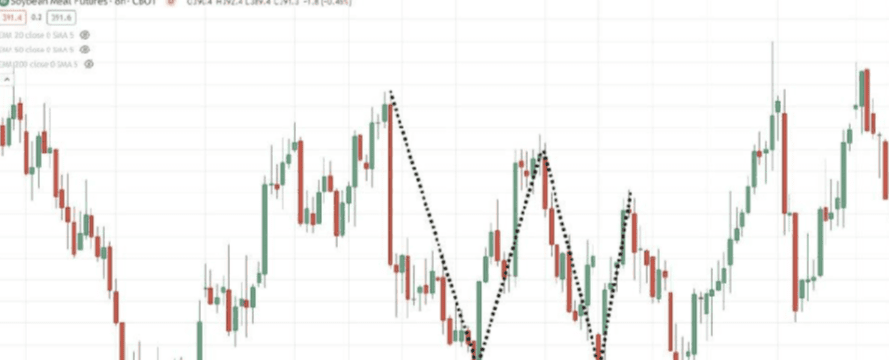
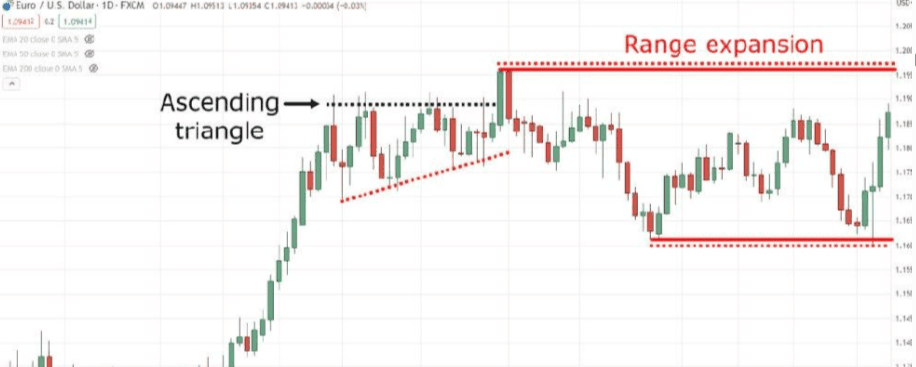
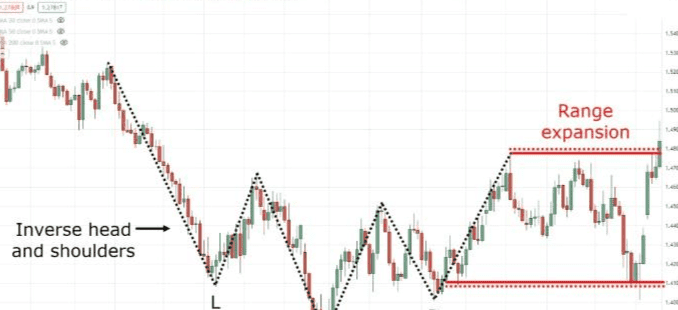
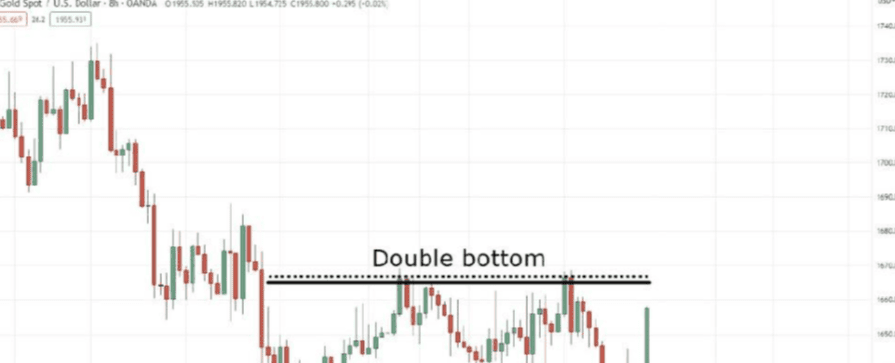
At this current stage, you may have mastered knowledge of many chart patterns, such as the double bottom pattern, ascending triangle structure, and inverted head-and-shoulders pattern, as shown in the figure below.
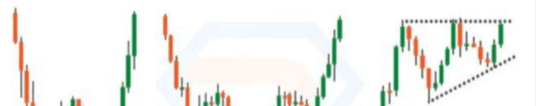
However, as you understand, not all chart patterns will consistently perform effectively. In this case, what measures should you take when these chart patterns fail to achieve the expected effect? As shown in the figure below.
When the range involved further expands, how will you act? As shown in the figure below.
At that time, what kind of trading activities do you plan to conduct in the market? As shown in the figure below.
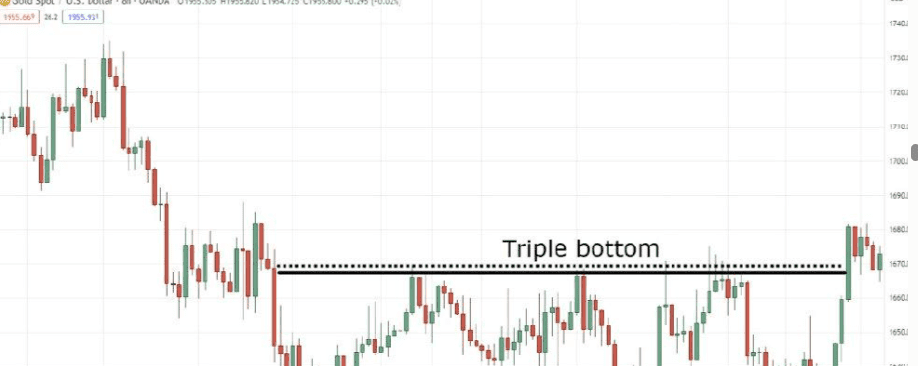
It is at this moment that the triple bottom pattern reveals its unique application value, as shown in the figure below.
The triple bottom pattern is one of the relatively rare chart patterns in the current market; however, it remains an indispensable tool for traders amidst market volatility.
In this guide, you will learn the following:
(1) A detailed guide to the operation mechanism of the triple bottom pattern.
(2) How to Avoid Misjudging the Triple Bottom Pattern (and the appropriate measures to take in this case);
(3) Correct Trading and Analysis Methods for the Triple Bottom Pattern.
(4) Step-by-step Procedure for Accurately Defining and Executing Triple Bottom Trades.
2. What is a Triple Bottom and How Does It Work?
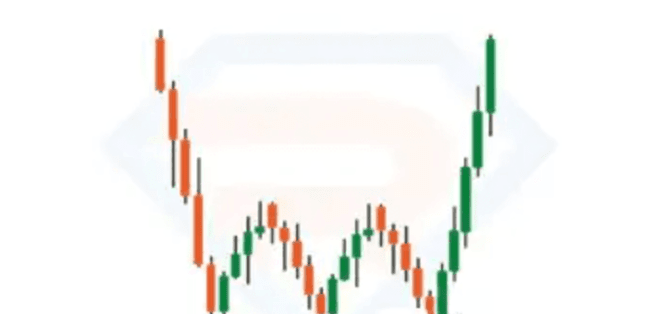
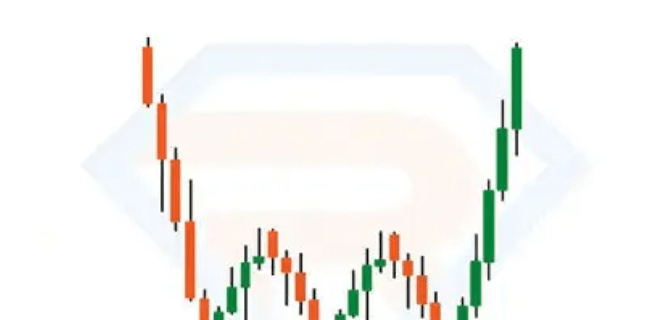
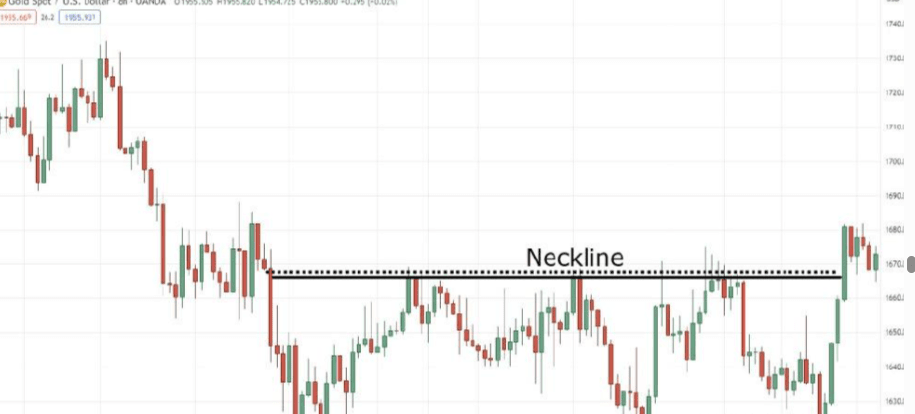
The triple bottom pattern is like a talented superstar, showcasing its unique talent on the market stage; it begins at the neckline, and this pattern is the support of the entire structure, as shown in the figure below.
Subsequently, in the dazzlingly complex presentation of the market, the three bottoms emerge in succession, each playing an indispensable role in this captivating pattern, as shown in the figure below.
This is like a meticulously choreographed synchronized dance, becoming the focus due to its eye-catching nature and laying the groundwork for potential trading opportunities; this pattern is indeed easy to identify.
Now that you understand the appearance of this pattern, how is the triple bottom pattern formed? If you are contemplating this question, you are heading in the right direction, as understanding 'why' something happens is often more crucial than merely knowing 'what' happens.
In this guide, we mainly discuss the following three reasons that lead to the formation of the triple bottom pattern.
(1) The market's indecisiveness.
Imagine the market as a capricious individual, its decision-making process indecisive, similar to a friend who cannot decide where to have dinner or which movie to watch. Thus, the triple bottom pattern emerges, resulting from the instability caused by the market's indecision, as shown in the figure below.
As if the market is saying: I can't decide which path to choose, have you noticed how the price range in the previous example continues to expand? It’s like a moment of paused confusion; however, it provides traders like us an opportunity to capitalize on the upcoming market decision. Therefore, essentially, we are discussing that the triple bottom pattern is a direct product of the market's indecision.
(2) Development takes time.
This pattern tends to develop gradually at its unique rhythm; however, this only makes it like a carefully slow-cooked dish, and the waiting process is worthwhile, just like watching a suspense movie where an experienced audience can foresee the climax of the plot. The market tests your patience, teasing you with its delicate fluctuations; for those willing to wait patiently and observe carefully, the triple bottom pattern offers a potential opportunity for substantial profits. Therefore, remain calm and allow this pattern to reveal its enticing trading opportunities at the right time. In fact, to further elaborate on this principle, you can effectively utilize the triple bottom pattern when the following situations arise.
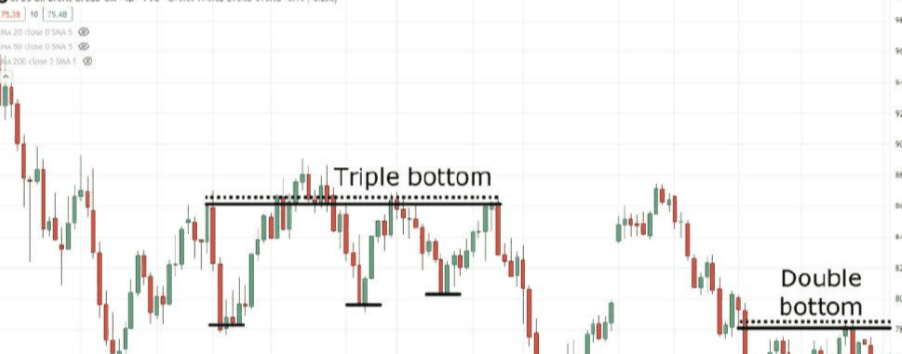
(3) You missed the double bottom pattern.
If you missed the double bottom pattern, as shown in the figure below.
You need not toss and turn in regret, for the triple bottom pattern can turn the situation around for you at this moment, providing another opportunity to participate in the market, as shown in the figure below.
This is like unexpectedly discovering a hidden treasure chest in despair, thinking all hope was lost; thus, this pattern provides an additional entry opportunity.
Now, I understand that trading the double bottom pattern may be more attractive, but the key is whether you can seize the opportunity. For cautious traders seeking more confirmation, closely monitoring the triple bottom pattern is worthwhile; it’s a pattern that can bring redemption, excitement, and substantial profits, adding value to your trading chart. Since you already understand the appearance and operating mechanism of the triple bottom pattern, next, I will explain under what circumstances you should avoid trading this pattern. Remember, all trading patterns have their own advantages and limitations.
3. The Biggest Mistake When Trading Triple Bottoms: Avoid These Traps.
(1) Error 1: Trading in the middle of the triple bottom pattern.
First, trading within the price range is like trying to wear a pair of overly tight jeans; it is inevitably uncomfortable. Remember, the triple bottom pattern typically forms during market indecision, where the market's behavior resembles a child in a candy store facing many tempting choices but hesitating. Therefore, you should resist the impulse to frequently enter and exit trades during the pattern formation process; rather, you should patiently wait for the market to make a clear decision.
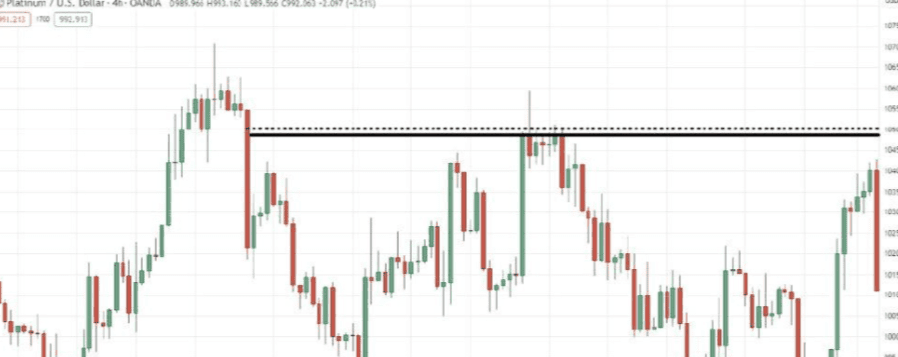
In summary, avoid trading during the intermediate stage of the pattern establishment process, as shown in the figure below.
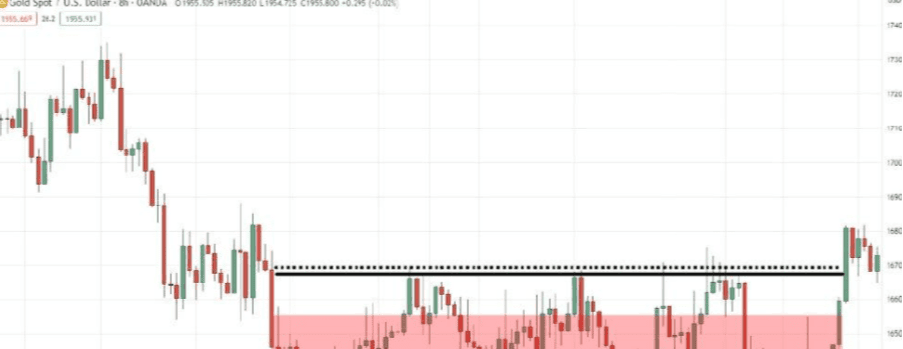
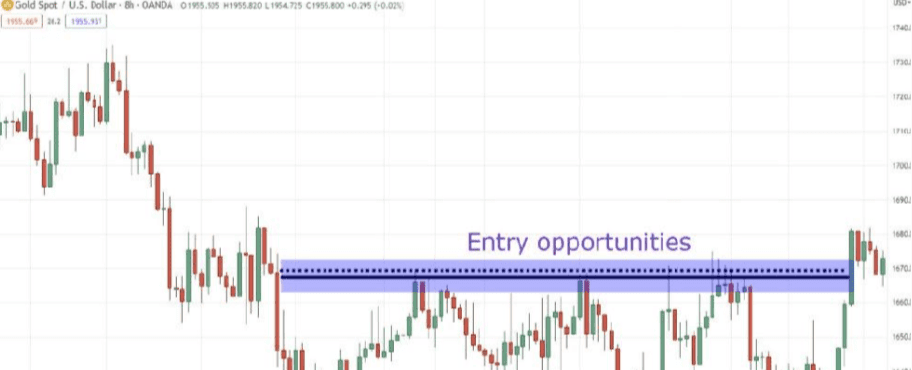
Please focus on the value areas, namely the so-called support and resistance levels, as shown in the figure below.
(2) Error 2: Blindly trading highs and lows.
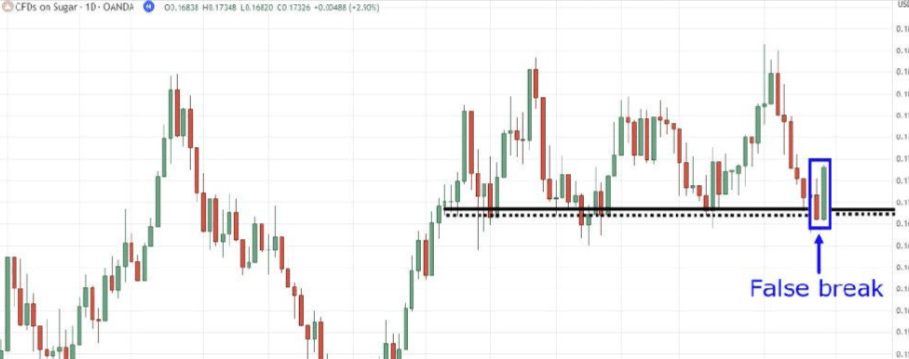
What does this mean? Should we not only avoid trading in the middle of the triple bottom pattern but also avoid trading at highs and lows? You should know that the triple bottom pattern is known for its frequent false breakouts, as shown in the figure below.
This is due to the inherent characteristics of range-bound markets, which expand and contract; the triple bottom may even evolve into a quadruple bottom, like a prankster lurking in the shadows, ready to jump out and give you a scare. Therefore, do not blindly chase the peaks and valleys of prices like an ignorant squirrel; instead, you should wait for market confirmation before trading, meaning you should patiently wait until the actual breakout occurs after the third bottom, as shown in the figure below.
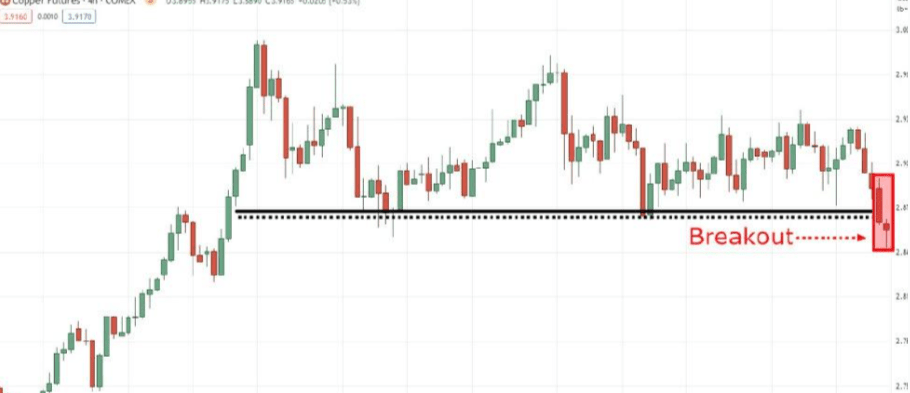
And the entry into this range should be confirmed at the price closing, serving as effective confirmation of the formation of the third bottom, as shown in the figure below.
Therefore, reaching highs and lows does not constitute a sufficient reason for immediate trading; instead, you should remain vigilant and wait for necessary additional confirmation signals.
(3) Error 3: Using the double bottom pattern to judge market direction.
Now, let’s clarify one point to correct a common misconception; although the triple bottom pattern may play a key role in the market, it does not possess the oracle-like ability to predict market direction, which means that even if you identify a triple bottom pattern, the market is not necessarily obliged to break to higher levels; the following scenarios may also occur, as shown in the figure below.
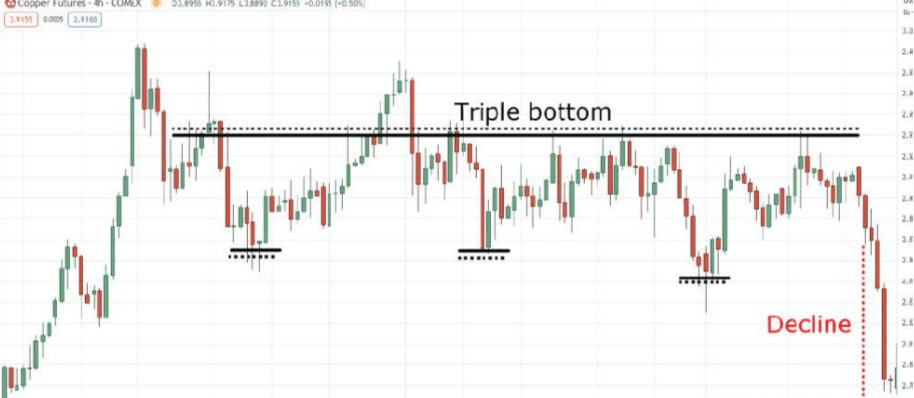
This is akin to expecting to predict tomorrow's lottery numbers through a crystal ball, which is nearly impossible, so you should not simply rely on the triple bottom pattern to determine the subsequent market trend; instead, you should analyze other relevant factors comprehensively and view the triple bottom pattern as one of the auxiliary tools, rather than the sole decision-making indicator.
(4) Error 4: Over-reliance on the 'Textbook' Triple Bottom
When discussing the triple bottom pattern, do not overly adhere to the definitions in traditional textbooks, as shown in the figure below.
This pattern is like a chameleon, changing in many ways, with each turn bringing new surprises, indicating that there are various effective variants of the triple bottom, as you have observed earlier, as shown in the figure below.
And this one, as shown in the figure below.
Therefore, please let go of your rigid expectations of the pattern and instead appreciate the beauty of its diverse forms; the key lies in those ‘sharp bottoms’ you identify on the chart.
Now, you may be pondering: I know how to identify this pattern and what behaviors to avoid when trading; how should I trade? If this is your question, now is the time to showcase your trading skills, as I will reveal the three key market trends to focus on when trading the triple bottom pattern.
4. Achieving the Ideal Strategy for Successfully Trading the Triple Bottom Pattern
(1) Ensure that the triple bottom is in the current uptrend.
By ensuring that your trading actions are in harmony with the current market uptrend, as shown in the figure below.
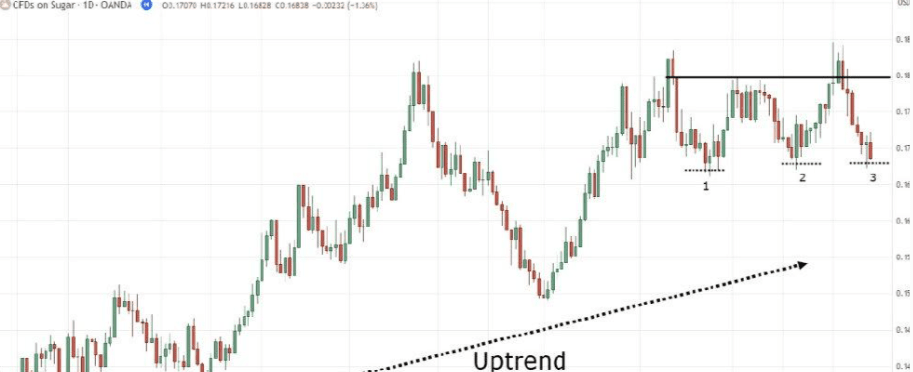
You are increasing the probability of trading success and aligning with the market's rhythm, focusing on this upward trend, just like an experienced dancer seeking an ideal partner, ready to elegantly spin and immerse themselves with the unfolding of the triple bottom pattern.
(2) Look for False Breakouts or Accumulation.
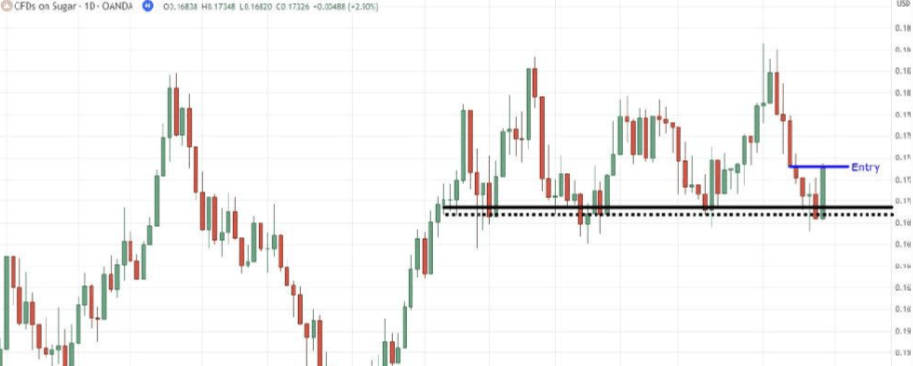
When you observe a false breakout at the third bottom, as shown in the figure below.
This is like noticing that your dance partner pretends to be tired on the dance floor but quickly regains vitality with their talent, signaling that the pattern is ready to take center stage in the market, as shown in the figure below.
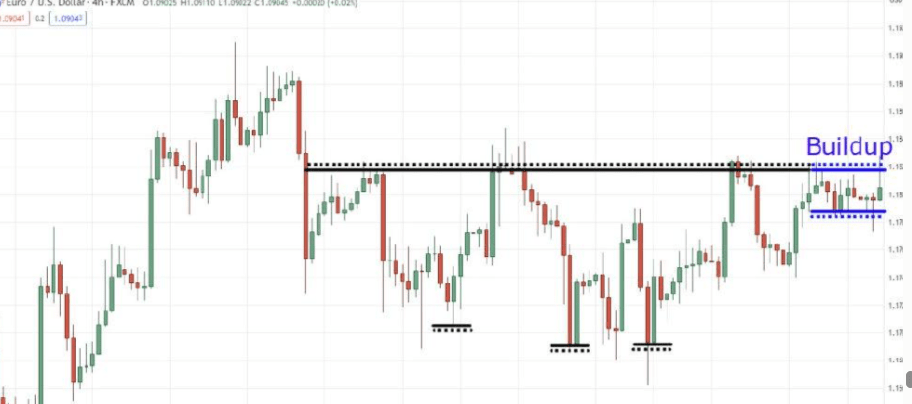
From another perspective, if you encounter the following situations: failing to grasp the entry timing for the double bottom pattern, missing the false breakout trading opportunity for the triple bottom pattern, do not worry, as there are still opportunities waiting for you, because if you observe price accumulation at the highs, as shown in the figure below.
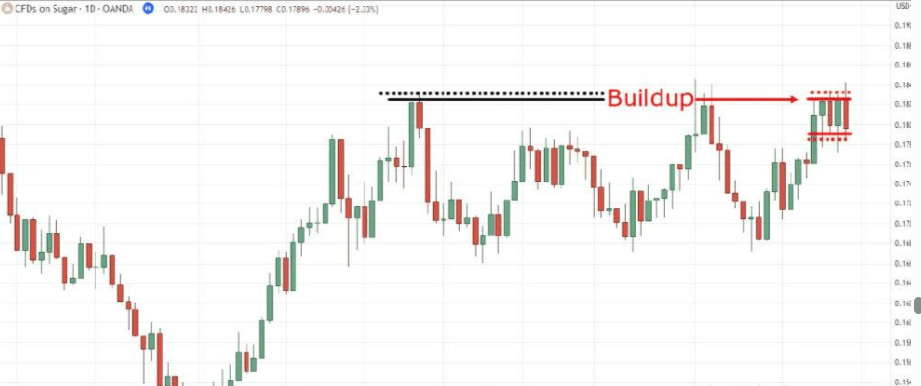
This is like witnessing the moment just before an electrified elevator starts, as this phenomenon indicates that the triple bottom pattern is preparing for a potential energetic breakthrough, as shown in the figure below.
Therefore, keep an eye on these cutting-edge market trends and be prepared to showcase your trading skills on the market stage. By this stage, you have mastered all the necessary key elements to successfully execute trades based on the triple bottom pattern, but as you well know, the effectiveness of the tools you possess depends on how you apply them. If you have been trading similar double bottom patterns for a long time, you are well prepared. However, if you are seeking a simple and clear guide to understand how to utilize the triple bottom pattern for market discovery, trading, and trade management, please continue reading the following content of this guide.
5. Master the Triple Bottom: A Trading Strategy That Lets You Dance in Profits.
(1) Step 1: First, identify the uptrend within the daily time frame.
Consider it as discovering the ideal rhythm, laying the groundwork for an engaging performance, exploring those continuously rising highs and lows that symbolize a strong uptrend, as shown in the figure below.
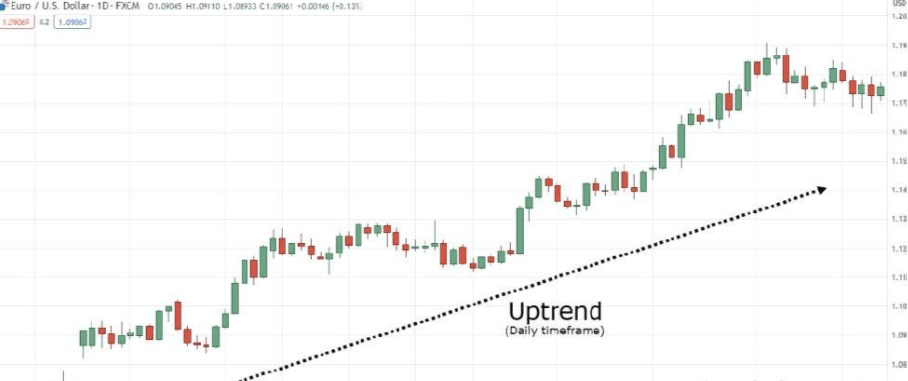
Once you confirm this uptrend, you can move on to the next stage, closely following the market's rhythm.
(2) Step 2: Identify the potential triple bottom within the 4-hour time frame.
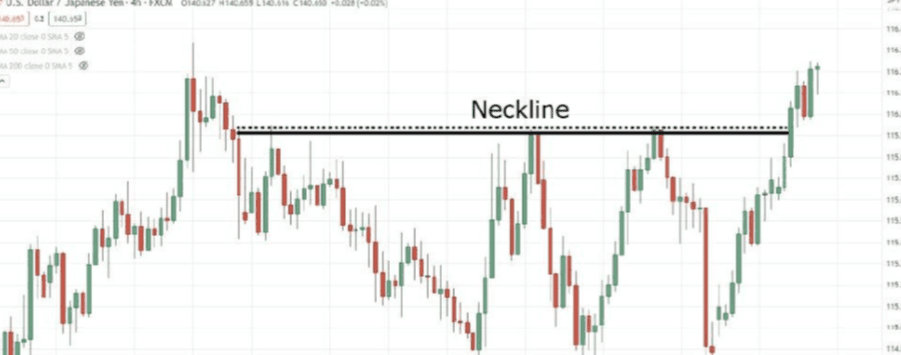
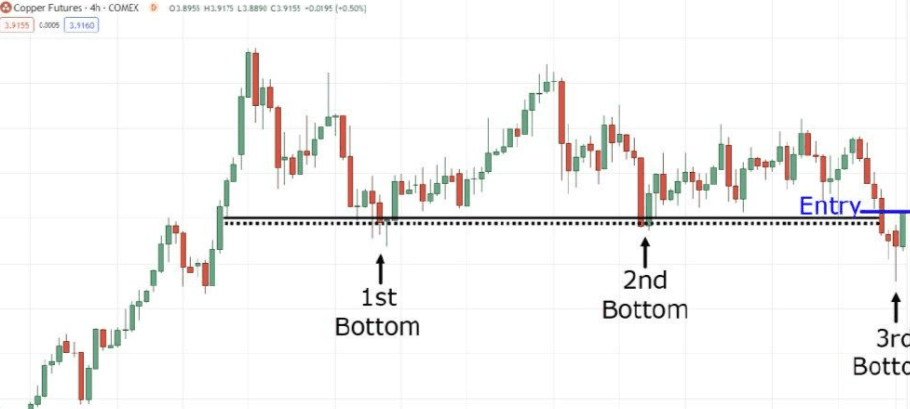
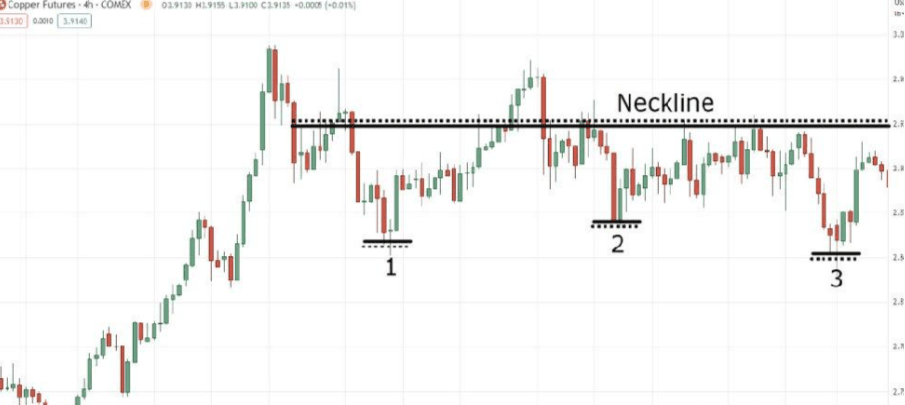
At this moment, please shift your focus to the 4-hour chart, where the potential triple bottom pattern will appear vividly. Comparing this process to dance choreography, where each step carries a specific goal, identify the triple bottom pattern, which is formed by three different bottoms connected by a neckline, as shown in the figure below.
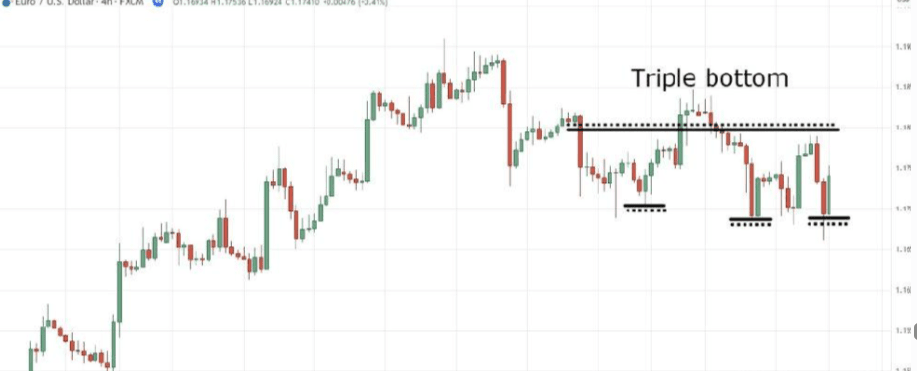
This is like observing a group of dancers synchronizing their steps, weaving an eye-catching pattern on the dance floor. Once you identify this masterpiece of the triple bottom pattern, you should begin preparing for precise trade entry.
(3) Step 3: Trade the False Breakout at Point 3
This is like executing an astonishing spin or quickly changing direction on the dance floor, leaving all spectators in awe; when the market briefly drops below the third bottom and then quickly rebounds, as shown in the figure below.
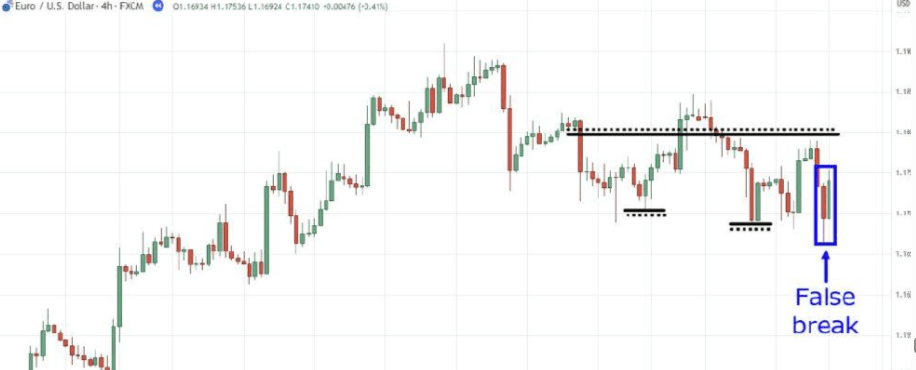
This is a sign that the pattern is ready to take center stage in the market. Therefore, act like an experienced dancer, join the trade in line with this momentum, showcase your trading skills, and seize the market opportunity, as shown in the figure below.
Timing is crucial; patiently wait for that false breakout to occur and quickly take action.
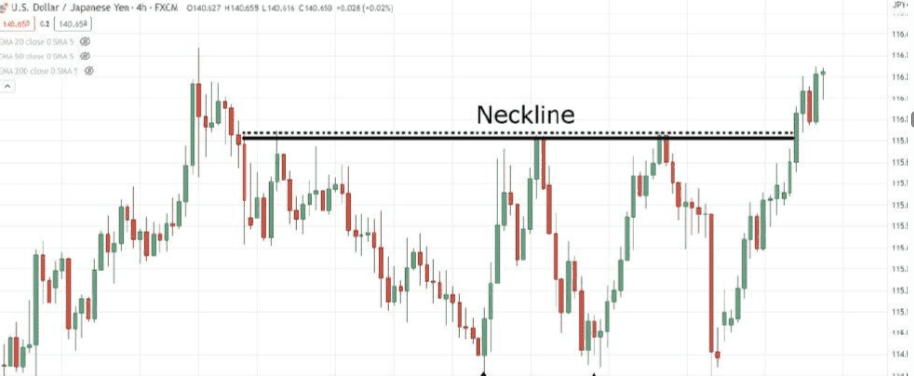
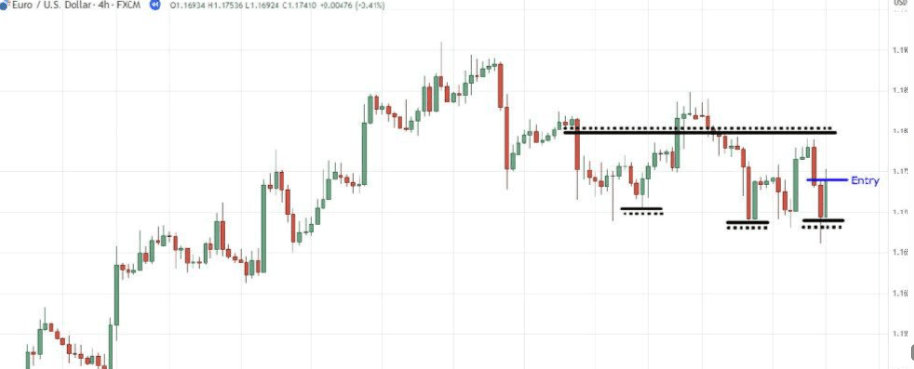
(4) Step 4: Accumulating Small Sizes at the Neckline.
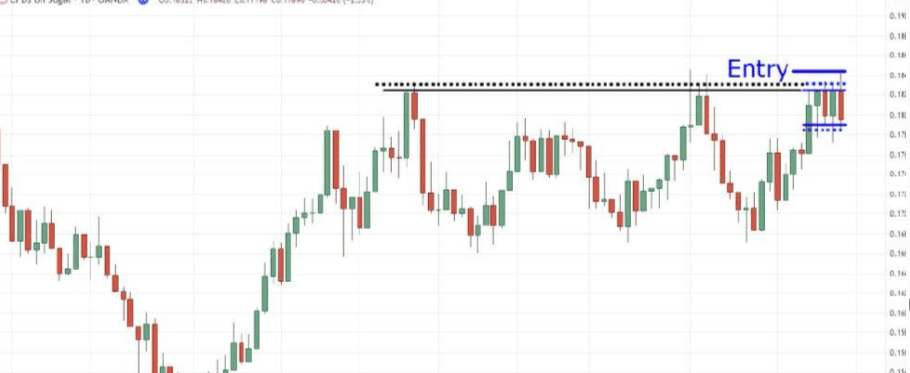
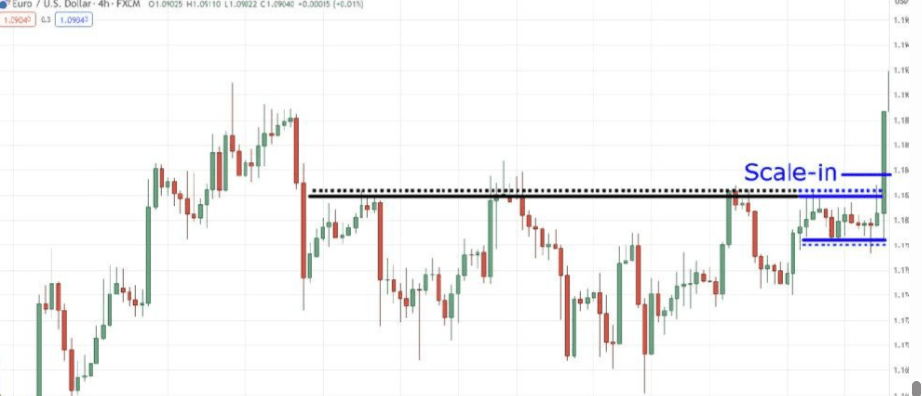
At this moment, it is time to enhance your trading performance; you may wonder: how to achieve this? By gradually reducing trading sizes near the neckline, as shown in the figure below.
Consider it as a grand upgrade in dance choreography, where energy surges to new peaks; when the price decisively crosses the neckline, it indicates that the triple bottom pattern is about to unleash its full market potential. In this situation, how should you act? In simple terms, you should increase your position size, expanding upon the initial trade to maximize your profit potential, as shown in the figure below.
This is like the crescendo in a musical piece, the key is that this breakthrough provides investors with an opportunity to ride the wave of victory.
(5) Step 5: Use the 20-period moving average to track stop losses.
Now that you have ventured into this field, how should you manage it? In this case, I recommend using the 20-period moving average as a trailing stop tool, as shown in the figure below.

This indicator is like a trustworthy dance partner, ensuring your safety on the trading stage. As the price moves in a way favorable to you, use this dynamic indicator to adjust your stop-loss position to protect your profits from being harmed, as shown in the figure below.
Here are other key points you should understand; you always have the right to choose between Stage 3 and Stage 4. For traders inclined to take higher risks, you can choose to trade in Stage 3 and Stage 4; if you are a more conservative trader, you can choose to enter the market when the price breaks the neck line (i.e., Stage 4); if your trading style is in between, you may consider taking action in Stage 3 instead of reducing your position, but rather expanding laterally in Stage 4.
Therefore, put on your trading 'battle boots,' practice these steps, and let this concise triple bottom strategy become your ticket to trading success.
6. Conclusion
Here is an overview of the core points of this guide:
(1) The triple bottom pattern provides a second entry opportunity for traders who missed the double bottom.
(2) It consists of a neckline and three different bottoms, typically forming during periods of market indecision and requiring some time to develop.
(3) When trading the triple bottom, common errors should be avoided, such as trading within the price range and over-relying on textbook patterns.
(4) The best trading approach is to align with the existing uptrend in the market and focus on false breakouts at lows or price accumulation at highs.
(5) A simple trading strategy includes identifying the uptrend, discovering the triple bottom pattern, trading false breakouts, adjusting position sizes at breakouts, and using the 50-period moving average as a trailing stop tool.
Simple and practical little tips for trading coins that let you profit steadily.
1. Invest in batches: Suppose you have 10,000 yuan, divide it into five parts, using only 2,000 yuan for each trade.
2. Test Investment: First, use 2000 yuan to buy a coin to test the waters.
3. Add to Position After a Drop: If the coin price drops by 10%, use 2,000 yuan to add to your position.
4. Take Profit When Prices Rise: If the coin price rises by 10%, sell part of it in time to lock in profits.
5. Repetitive Cycle: Continue buying and selling until funds are exhausted or coins are sold out.
Strategic Advantages: The benefit of this strategy is that even if the coin price declines, you can remain calm. By entering in batches, you avoid the risks of a lump-sum investment. Even if the coin price drops by half, you are only gradually increasing your position. And each time you sell, you can lock in a 10% profit. For example, if you have 100,000 yuan, investing 20,000 yuan each time means you can earn 2,000 yuan each time.
If you are also a technical person and are deeply studying technical operations in the coin circle, feel free to follow me for the latest coin circle intelligence and trading techniques!


