Based on the attached chart for BNB/USDT analysis on a one-hour time frame (1h), here is an accurate technical analysis of the current situation:
📈 Key Data:
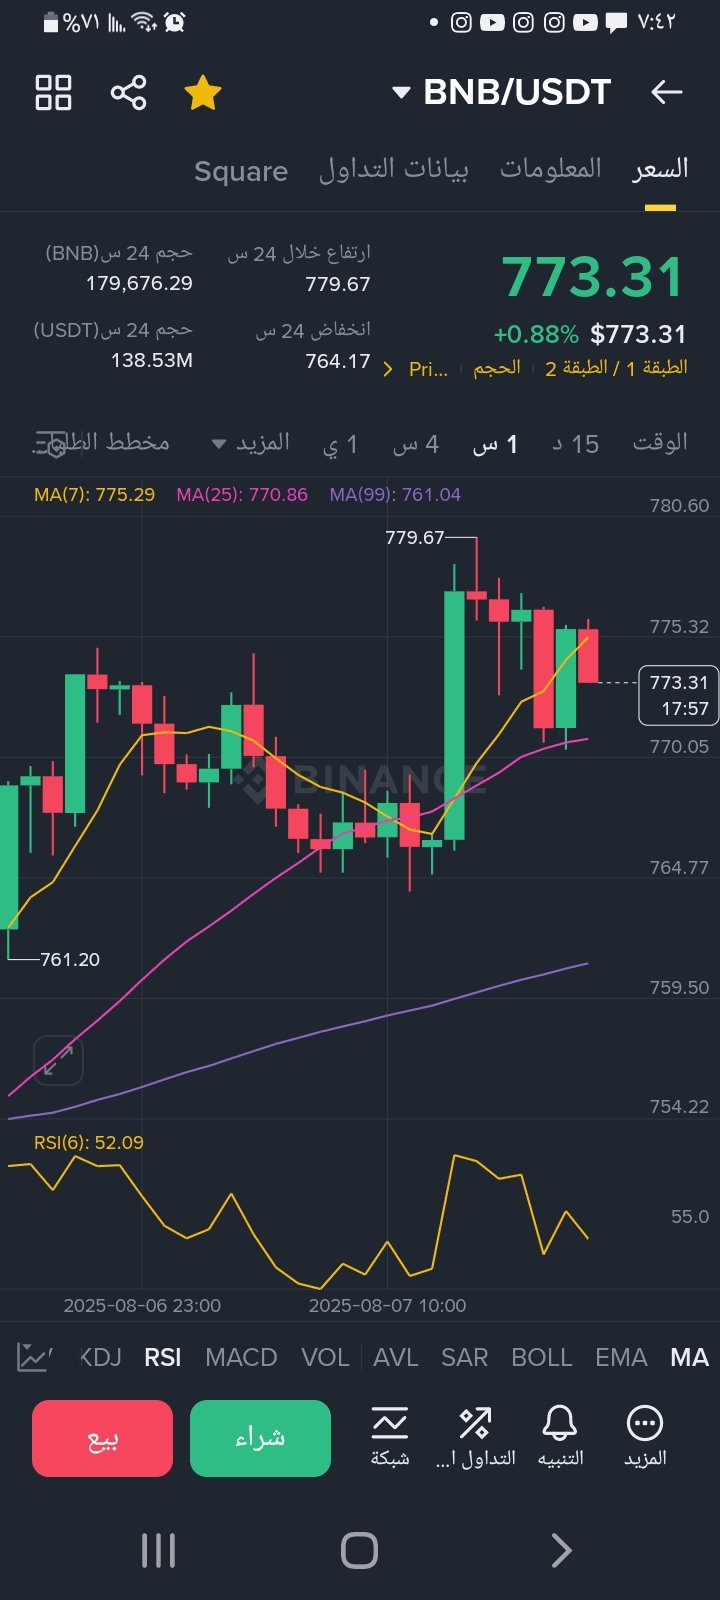
✅ Current Price: 773.31 USDT
📉 Highest Price in 24 Hours: 779.67
📉 Lowest Price in 24 Hours: 764.17
📊 Trading Volume in 24 Hours: 138.53M USDT
⏰ Time Frame: One Hour
💹 RSI(6): 52.09 (Neutral Zone)
🔄 Moving Averages:
MA(7) = 775.29 (Above Current Price, Nearby Resistance)
MA(25) = 770.86 (Currently Support)
MA(99) = 761.04 (Strong Support in the Medium Term)
🔍 Detailed Technical Analysis: ✅ Overall Trend:
The price is currently moving in a slightly upward sideways range after a strong bounce from the 764.17 area.
A peak was recorded at 779.67, then the price clearly declined with the appearance of a sharp red candle, followed by a green candle indicating an attempt to bounce.
📉 Supports and Resistances:
First Support: 770.00 (Crossover with MA25)
Second Support: 764.17 (Previous Day's Low)
Strategic Support: 761.04 (MA99)
Current Resistance: 775.29 (MA7)
Strong Resistance: 779.67 (Today's Peak)
📊 Technical Indicators:
RSI (6) = 52.09: Indicates a balance between buyers and sellers, no overbought or oversold condition.
Candlesticks: A potential "Double Top" pattern may form if the price fails to break 779.67 again.
MA7 has a bearish crossover above the price: indicating short-term resistance.
✅ Expected Scenarios: 🔼 Bullish Scenario:
If 775.30 is broken with strong trading volume, the price may return to test 779.67.
Breaking 779.67 means completing the bullish trend and possibly targeting 785–790.
🔽 Bearish Scenario:
If the price breaks 770.00 with confirmation from RSI and MA25 breakout, we expect a drop towards 764.00 then 761.00.
Breaking 761.00 will be a strong negative signal for further decline.
📌 Trading Tips Now:
Intraday Speculation: It is not advisable to enter currently until a confirmation candle of a breakout or breakdown appears.
Daily Investor: Watch the 770.00 area, it is critical, and buying from there with a stop loss below 764.00 could be good.
Strong Buy Signal: Upon breaking 775.50 firmly with a strong green candle.
Sell/Exit Signal: Breaking 764.00 or if the price fails to surpass 775.00 again.