
A completed Wave 4 and bullish Fibonacci bounce signal ETH’s next leg higher is underway.
There is a high capital inflow and positioning in the futures market, which supports the bullish run of Ethereum.
Although it has experienced several rejections around the 4,000 mark, ETH trades at high lows—a pointer that could lead to a breakout.
There is a positive indication of Ethereum, as technical and derivatives data indicate that it might break past levels in excess of 4000 dollars. The price action aligns with wave theory and increasing open interest, signaling market strength. ETH is trading near $3,681, and a push toward $4,500 is becoming a key focus.
ETHUSD Shows Wave Structure Supporting Upside
The structure of the price movement of Ethereum shows that a full corrective Wave 4 is completed, and Wave 5 might be underway on the 3-day chart. Analysts point out that ETH pulled back at the 50 percent Fibonacci retracement as the past support is visible. A zone of Fibonacci between 0.618 and 0.65 served as a bouncing zone, resisting the downward trend.
$ETH: Ethereum's Potential: Is the Bottom In?
Full Video: https://t.co/Tn8Fa1cv9F pic.twitter.com/9sLAPyqVuc
— More Crypto Online (@Morecryptoonl) August 7, 2025
Elliott Wave labeling shows sub-waves forming, which supports an extended upward move if ETH maintains current levels. The chart reflects earlier waves with strong impulses, indicating that price continuation is likely. If ETH surpasses $4,000, the wave structure suggests $4,500 is a logical target.
ETHUSD now trades under heavy observation, as it must break the $4,000 resistance to validate the fifth wave projection. Previous peaks align with strong rejection zones, but volume and trend structure show readiness for a breakout. Traders are watching for a firm candle close above $4,000.
ETH Futures Open Interest Backs Bullish Outlook
ETH futures open interest has steadily increased since June, aligning with price gains across spot and derivative markets. Data from Coinglass confirms a surge in open interest, which reached multi-year highs as ETH neared $4,500. This pattern reflects strong market participation and capital inflows.
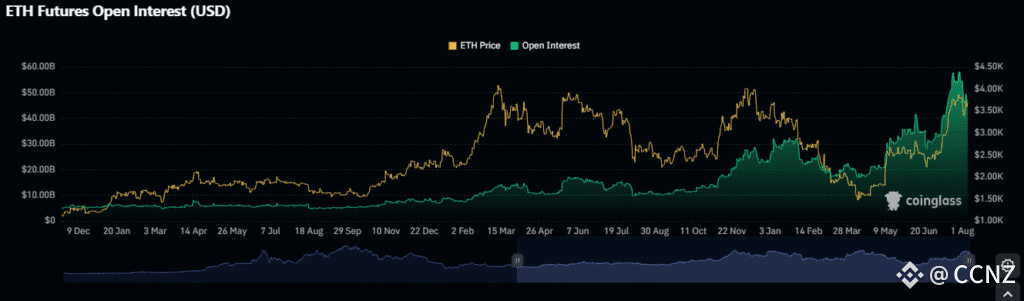
Open interest rising with price usually indicates new capital rather than profit-taking, suggesting stronger positioning. The current trend supports the wave structure analysis and confirms bullish behavior. If open interest continues climbing, Ethereum may extend gains without deep retracements.
Unlike past cycles, this rise shows sustained demand and leveraged exposure without major sell-offs. Earlier phases saw drops after peaks, but this rally has broader participation. ETH may soon test the $4,500 level if support zones hold and sentiment remains aligned.
ETH Faces Resistance But Maintains Higher Lows
On the weekly chart, Ethereum faced four rejections at the $3,950–$4,000 zone but has continued forming higher lows. Price remains inside a tight consolidation range, but the longer it holds, the higher the breakout probability. ETH’s price action shows pressure building just under resistance.
Ethereum $ETH: 4 consecutive rejections!
What happens next? pic.twitter.com/SYBOTMcbkT
— Ali (@ali_charts) August 7, 2025
Repeated failures to break $4,000 usually indicate exhaustion, but not in this case. Market structure holds, and the reaction to pullbacks is quick and shallow. This behavior supports the view that ETH will make another attempt soon.
Support levels below include $3,200 and $2,400, but these remain untouched in the latest rally. The higher lows suggest strength despite resistance. ETH is close to unlocking the next move, and the target remains $4,500.
Disclaimer: This article is for informational purposes only and does not constitute financial advice. CoinCryptoNewz is not responsible for any losses incurred. Readers should do their own research before making financial decisions.
<p>The post Ethereum ETH at $4,500? Wave Theory Meets Open Interest in Bullish Sync first appeared on Coin Crypto Newz.</p>

