
XRP is currently showing mixed signals, with short-term support still being maintained, but warning signs have appeared on the long-term chart. XRP is also signaling bearish divergence. This is not a short-term signal and does not mean that XRP will collapse today or tomorrow.
However, this also means that the upward momentum may weaken in the coming weeks or even months. This signal has been present for some time and has not disappeared, so it remains a key risk factor for XRP holders.
Daily Chart: Holding Support... Currently
On the daily chart, XRP is currently bouncing from the Fibonacci support level near $2.90. The area between $2.90 and $3.00 is acting as a strong support zone. If the price maintains above this area, we may see more short-term bounces.
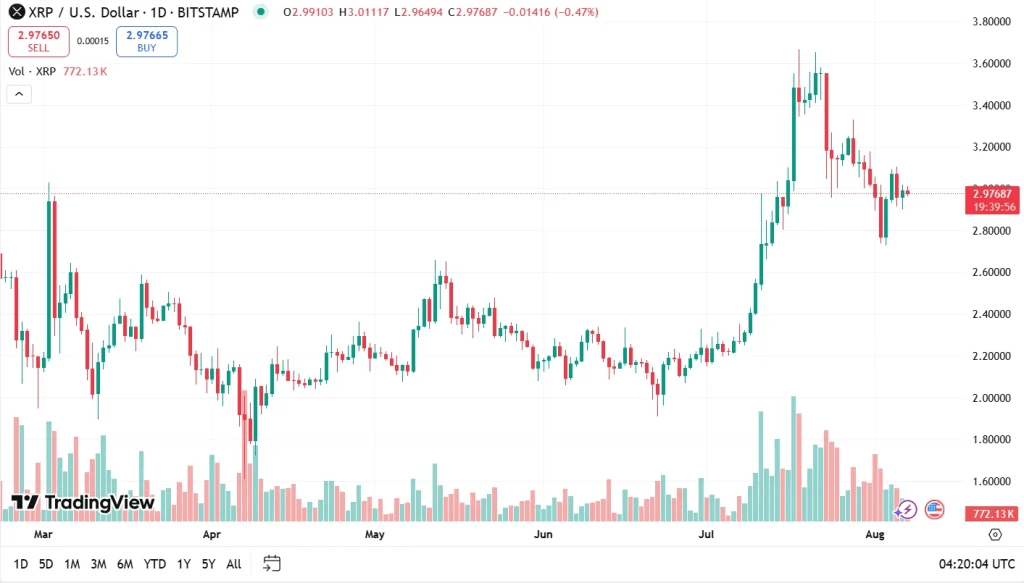
However, if XRP closes below $2.90, there is a possibility that the price will drop to $2.75. Below that level, there is another important support zone between $2.55 and $2.62, which could act as a safety net in case of a sharper price decline.
Resistance Levels to Watch
In the short term, XRP will face resistance around $3.10, with stronger barriers lying between $3.10 and $3.20. If the buyers can overcome this area, the next resistance level will be near $3.40.
However, currently, XRP seems to be stuck in a range, with support holding firm but resistance preventing it from rising significantly.
The Price Pattern Still Looks Familiar
Interestingly, the current price pattern of XRP looks very similar to the chart from earlier this year. Despite minor daily fluctuations, there haven't been many changes in the past few days. This means that the overall structure remains intact and has not yet shown signs of a strong recovery.
The Altcoin Season Has Not Yet Arrived
Looking at the Bitcoin dominance chart, there are still no signs that an altcoin season is about to begin. Bitcoin's dominance is maintaining above the support level of 60.5% to 61%. As long as this level is held, altcoins like XRP could continue to follow Bitcoin without showing significant independent growth.
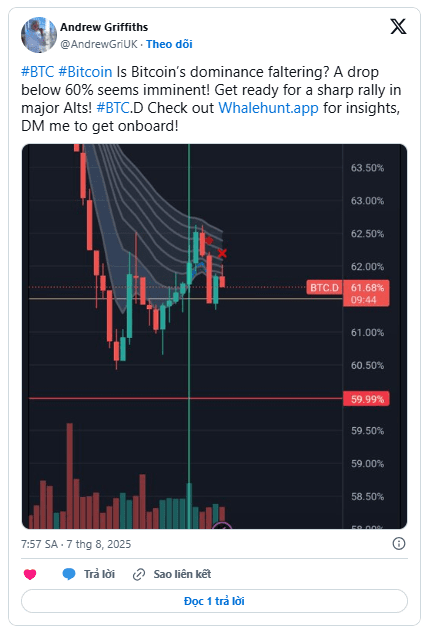
If Bitcoin dominance remains unchanged or increases, the altcoin market may be more heavily impacted. Conversely, if Bitcoin dominance is broken, it would increase the likelihood of altcoins, including XRP, experiencing stronger growth.