Learn these candlesticks and you won't face any losses in cryptocurrencies ☑️☑️👇
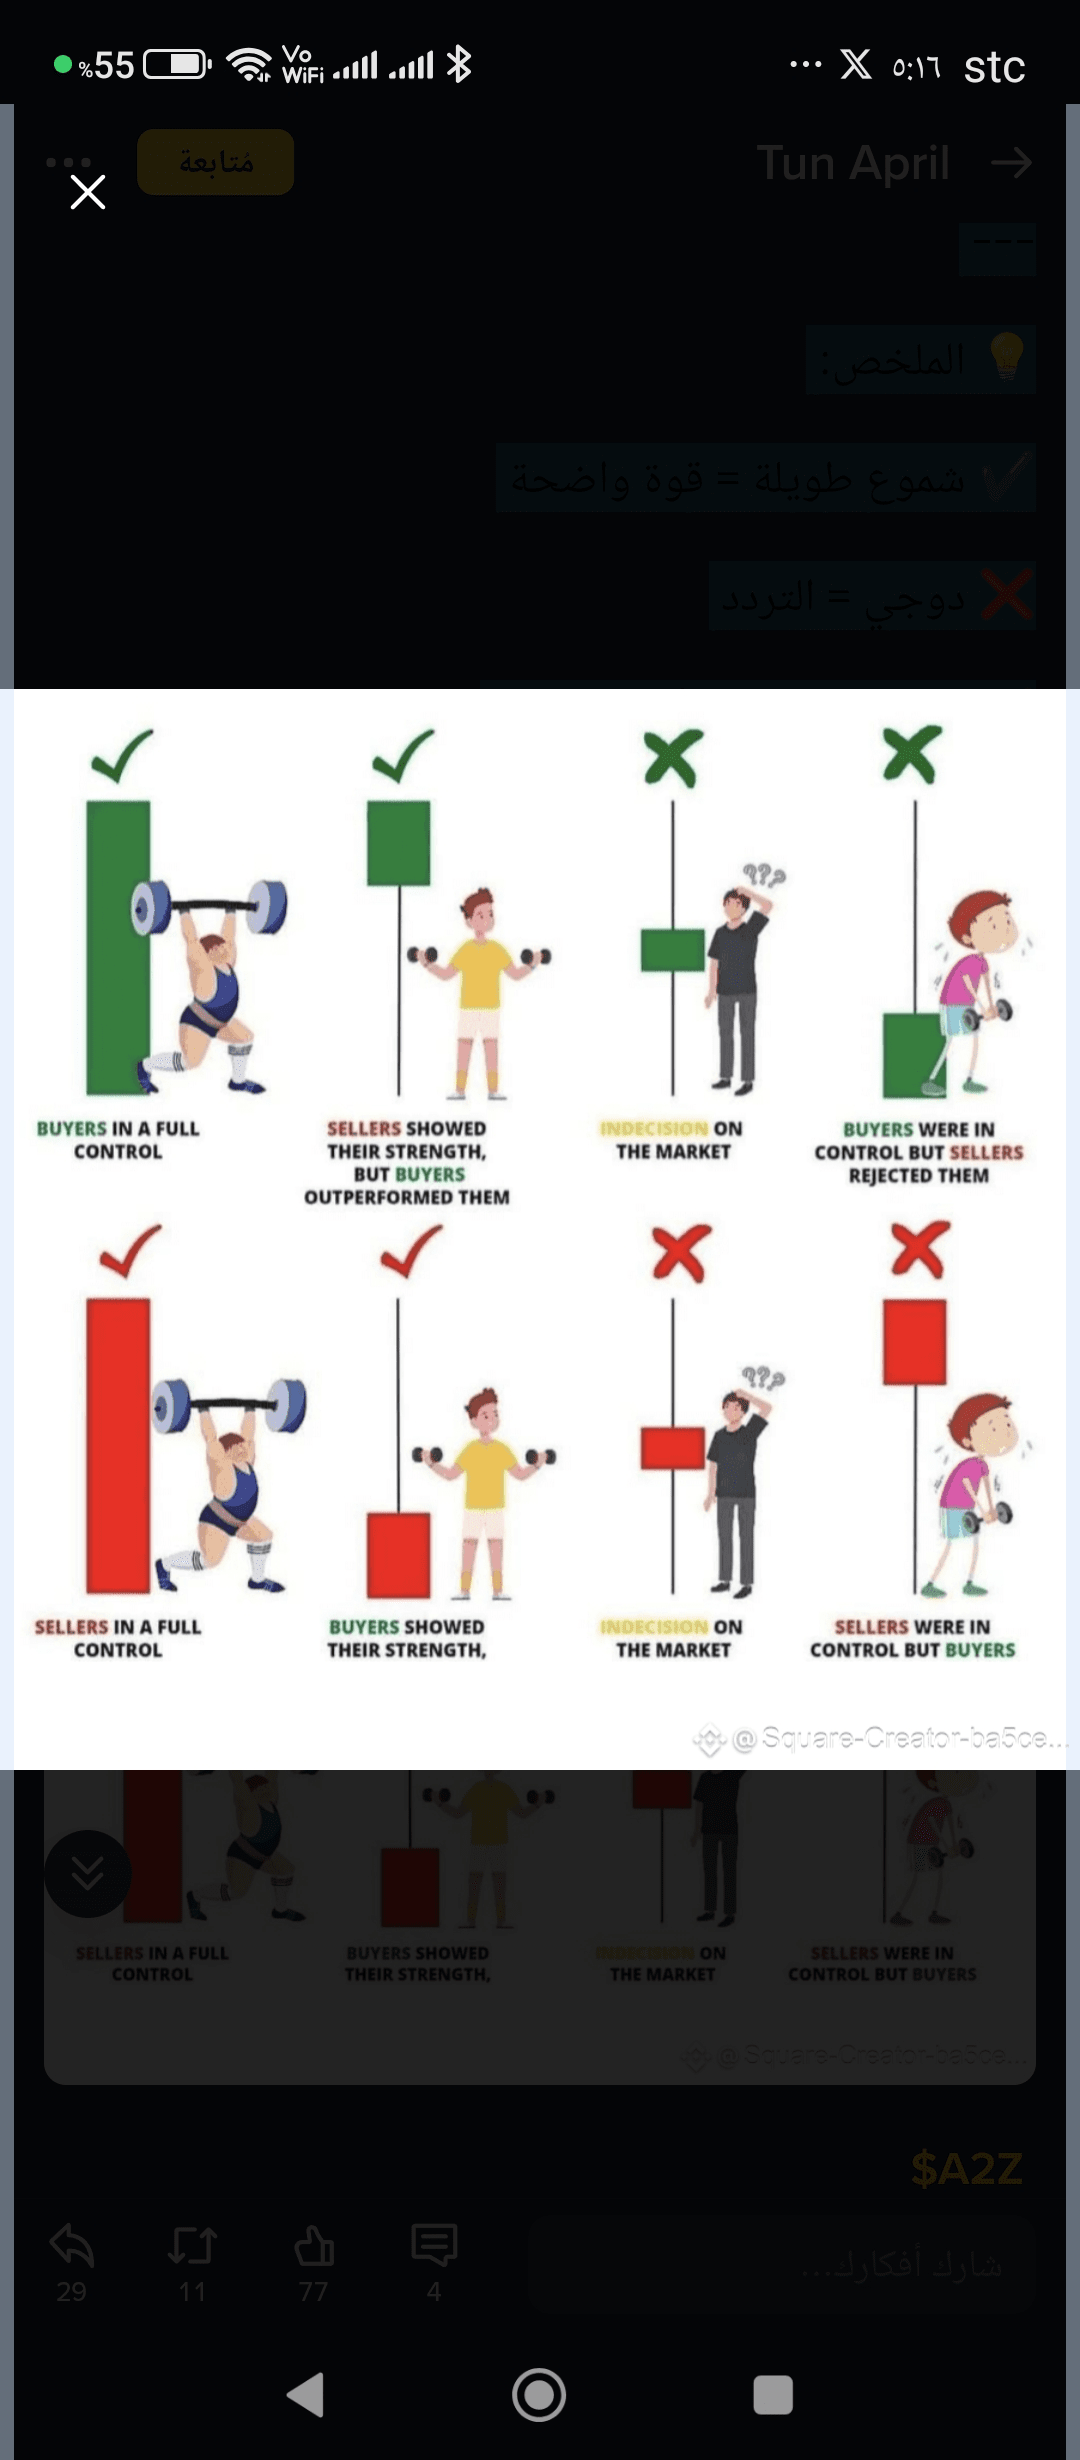
🔹 Top row (from left to right):
1. ✅ Buyers are in complete control
🟩 Large green candle - Strong bullish momentum, buyers dominated the session.
2. ✅ Sellers showed strength, but buyers prevailed
🟩 Long lower wick - Sellers pushed the price down but buyers recovered and closed at a higher level.
3. ❌ Indecision in the market
🟫 Doji candle - Equal pressure from buyers and sellers, indicating uncertainty in the market.
4. ✅ Buyers were dominant but sellers rejected them
🟩 Long upper wick - Buyers pushed the price up, but sellers forced the price to close at a lower level.
---
🔹 Bottom row (from left to right):
5. ✅ Sellers are in complete control
🟥 Large red candle - Strong bearish momentum, sellers dominated the session.
6. ✅ Buyers showed their strength
🟥 Long lower wick - Buyers tried to fight back after sellers pushed the price down.
7. ❌ Indecision in the market
🟧 Small body candle with wicks - Uncertainty; no clear winner between buyers or sellers.
8. ❌ Sellers were dominant but buyers rejected them
🟥 Long lower wick - Sellers pushed the price down but buyers regained ground before closing.
---
💡 Summary:
✔️ Long candles = Clear strength
❌ Doji = Indecision
✔️ Wicks = Rejection or Recovery
This chart helps you read the emotions behind the candlesticks 🧠🔥
And here is a candlestick image$BTC $ETH