Stellar (XLM) showed early signs of recovery last month, but over the past twenty-four hours, its price has dropped by more than 4%. After a strong 53% rise in July, XLM has begun to look volatile, and a key technical signal warned of the possibility of another decline.
By looking at shorter time frames, investor sentiment, and price levels, we can get an early reading on whether this weekly downward trend has more room to continue.
The two-hour chart shows a bearish signal: confirmed by net inflows.
To understand whether this weakness is just a quick dip or the beginning of a larger correction, it is helpful to study shorter time frames.
On the two-hour chart, the twenty-period exponential moving average (EMA), or the red line, crossed below the fifty-period exponential moving average (the orange line), a situation often referred to as a 'death cross.' This generally indicates increasing short-term selling momentum.
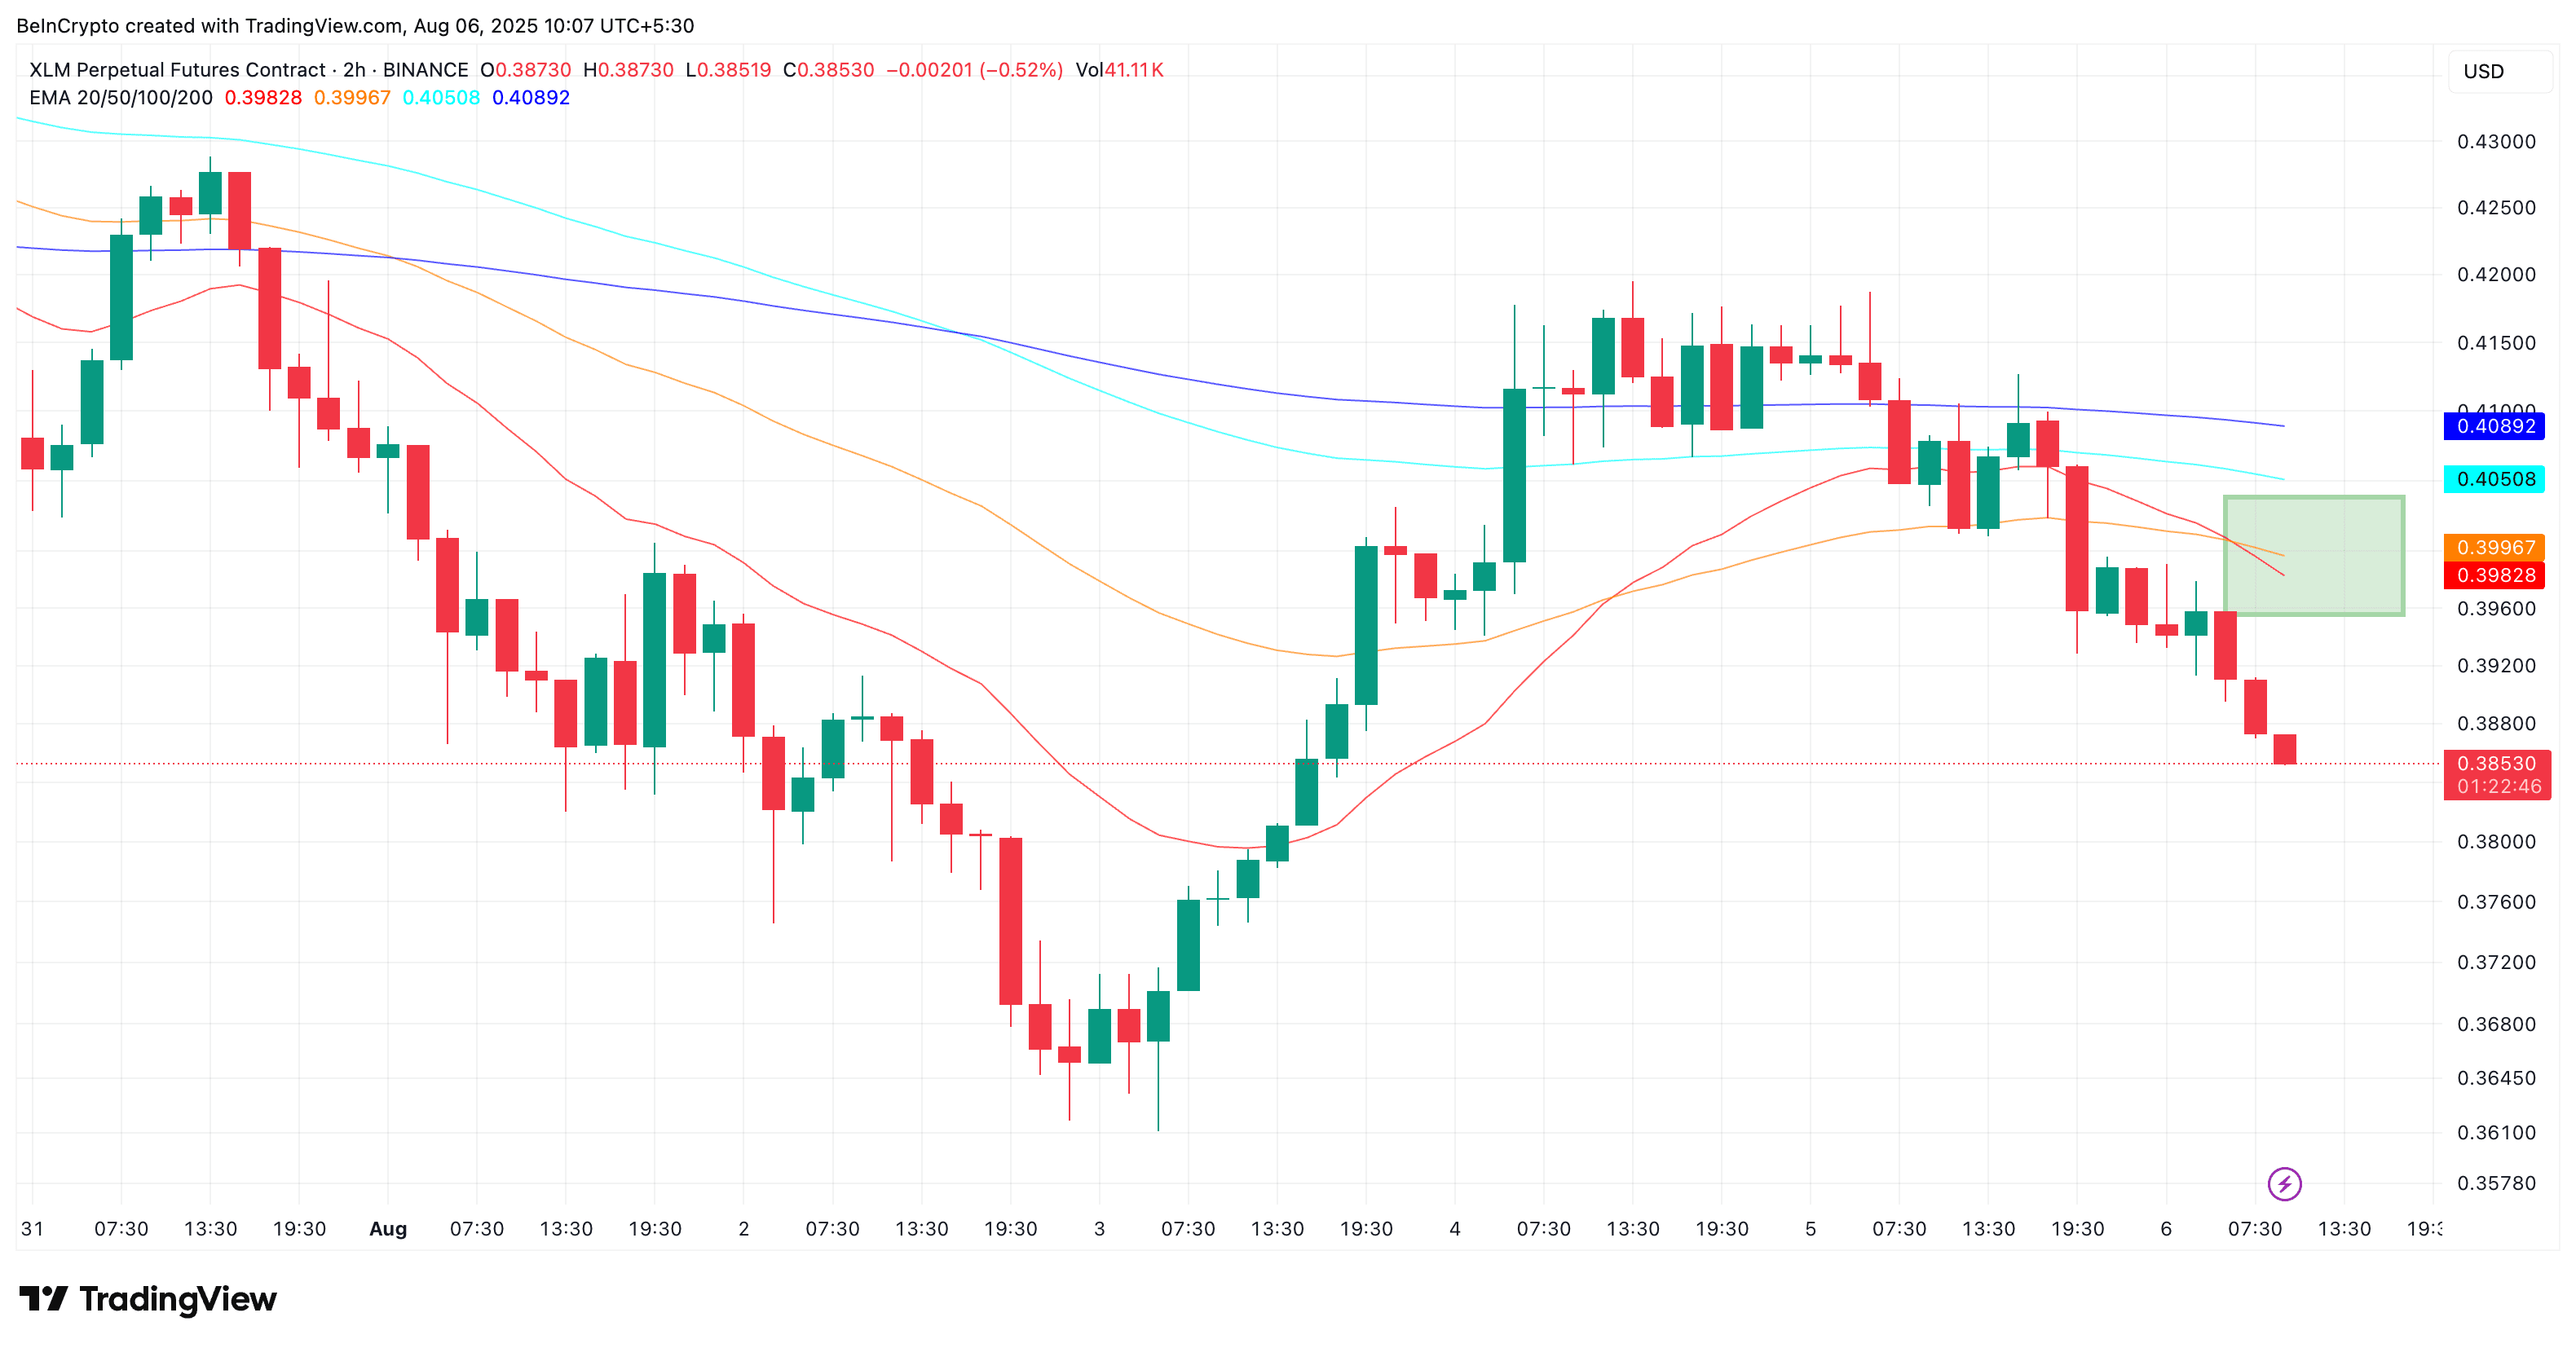
The exponential moving average (EMA) crossover occurs at the intersection of another moving average line on the chart. A short-term exponential moving average crossover (like a 20-period moving average) below a long-term exponential moving average (like a 50-period moving average) indicates that short-term selling may increase.
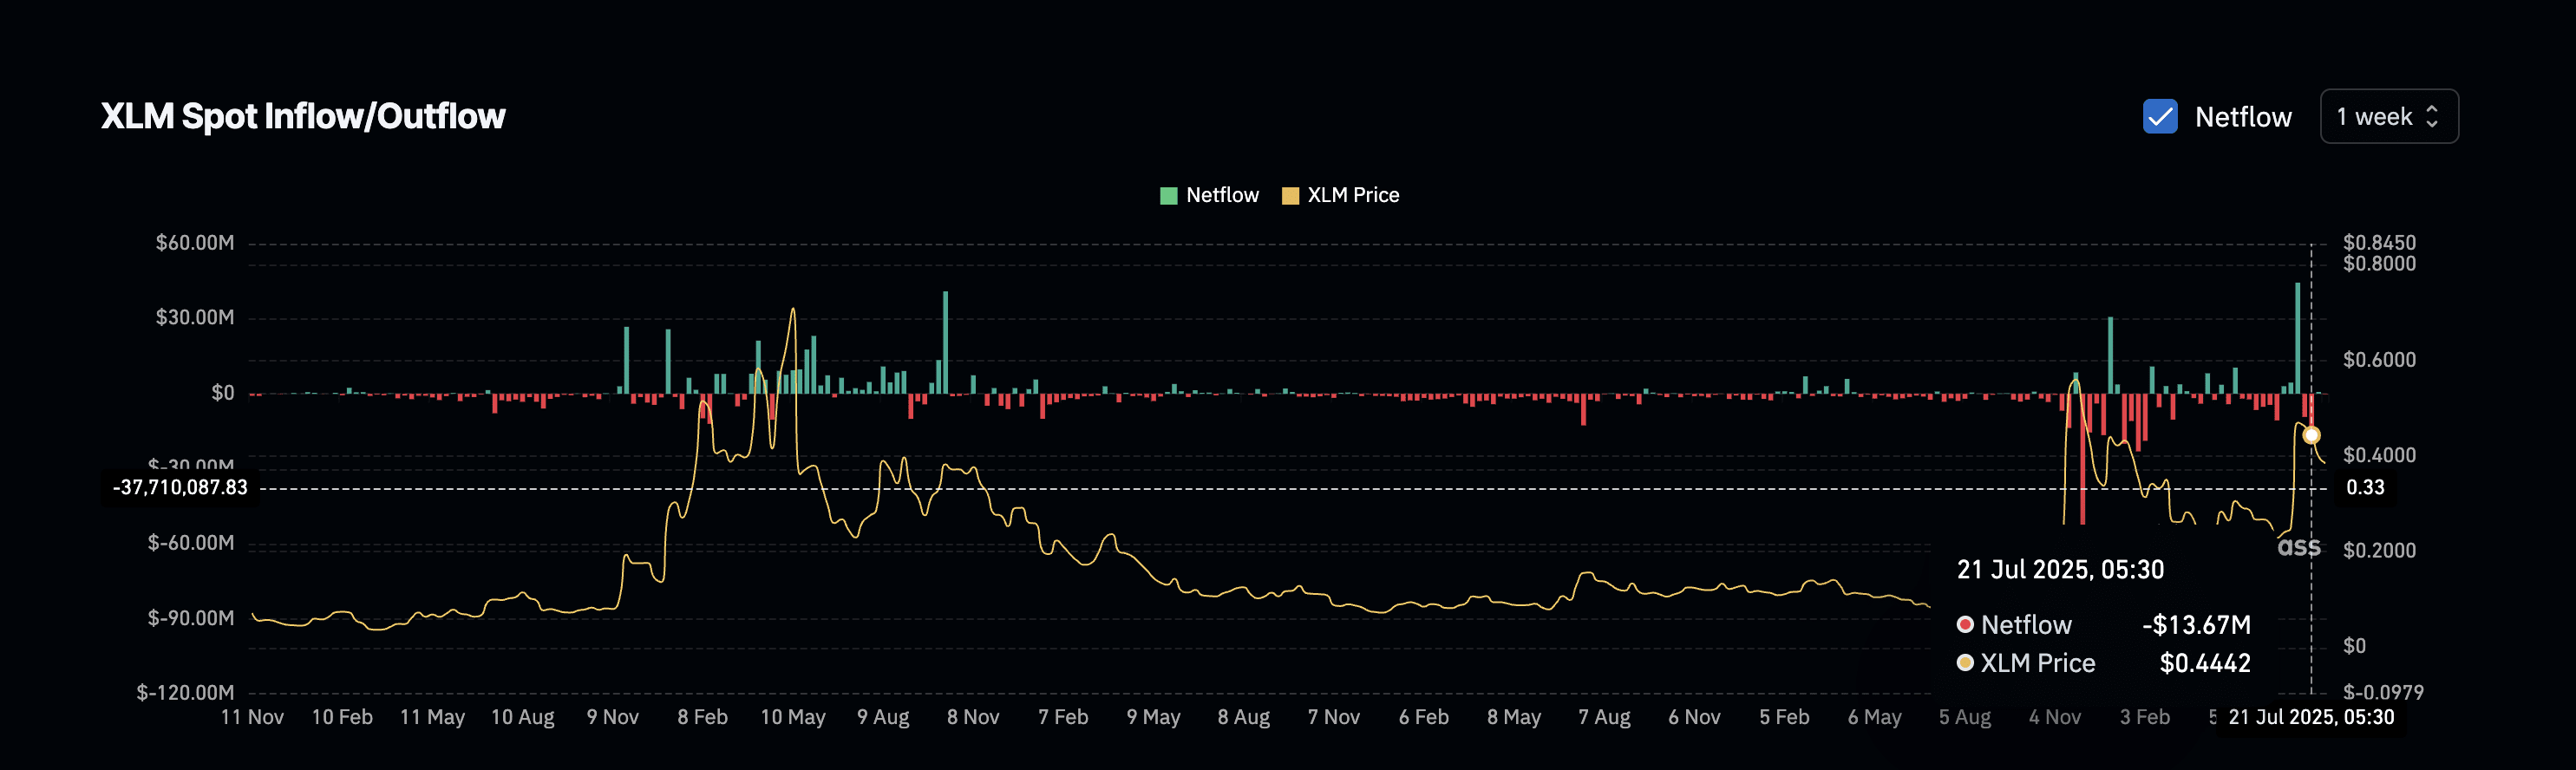
This change in net exchange flows supports this. Over the past two weeks, net flows have been slightly negative, meaning that the number of XLM tokens leaving exchanges has been greater than the number entering them.
But this week, flows have finally turned positive (even if just a small green point). This is a warning sign, as it often means that holders are ready to sell.
Bearish momentum is increasing, supported by market bias.
Even after surpassing chart signals, the market trend shows a return of bearish momentum. The Bull and Bear Power (BBP) indicator, which compares recent highs and lows to immediate buying strength, has sharply turned downward over the past two sessions.
This indicates that buyers are struggling to keep up with prices, with sellers pushing the price of Stellar downward.
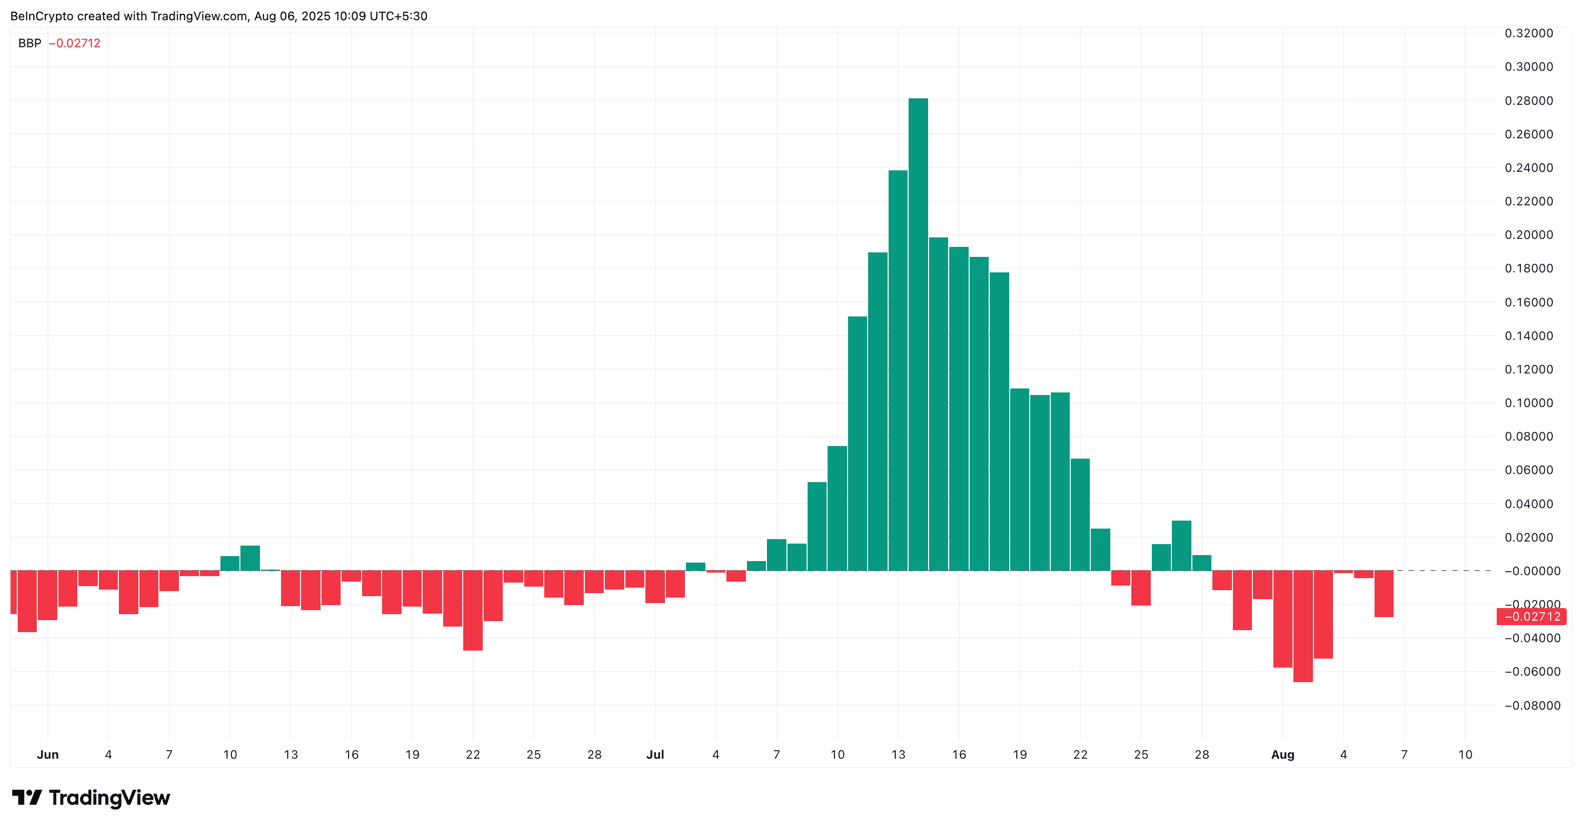 The BBP indicator measures the strength of buyers (bulls) against sellers (bears) in recent price movements. When it is negative, it shows bear dominance.
This shift is also evident in the buy/sell ratio. According to Coinglass, 60.67% of traders are currently holding short positions on XLM, indicating that most expect a further decline in the price of Stellar (XLM).
While a very short market can sometimes lead to a short squeeze, in this case, it aligns with XLM's negative price movement and trend indicators.
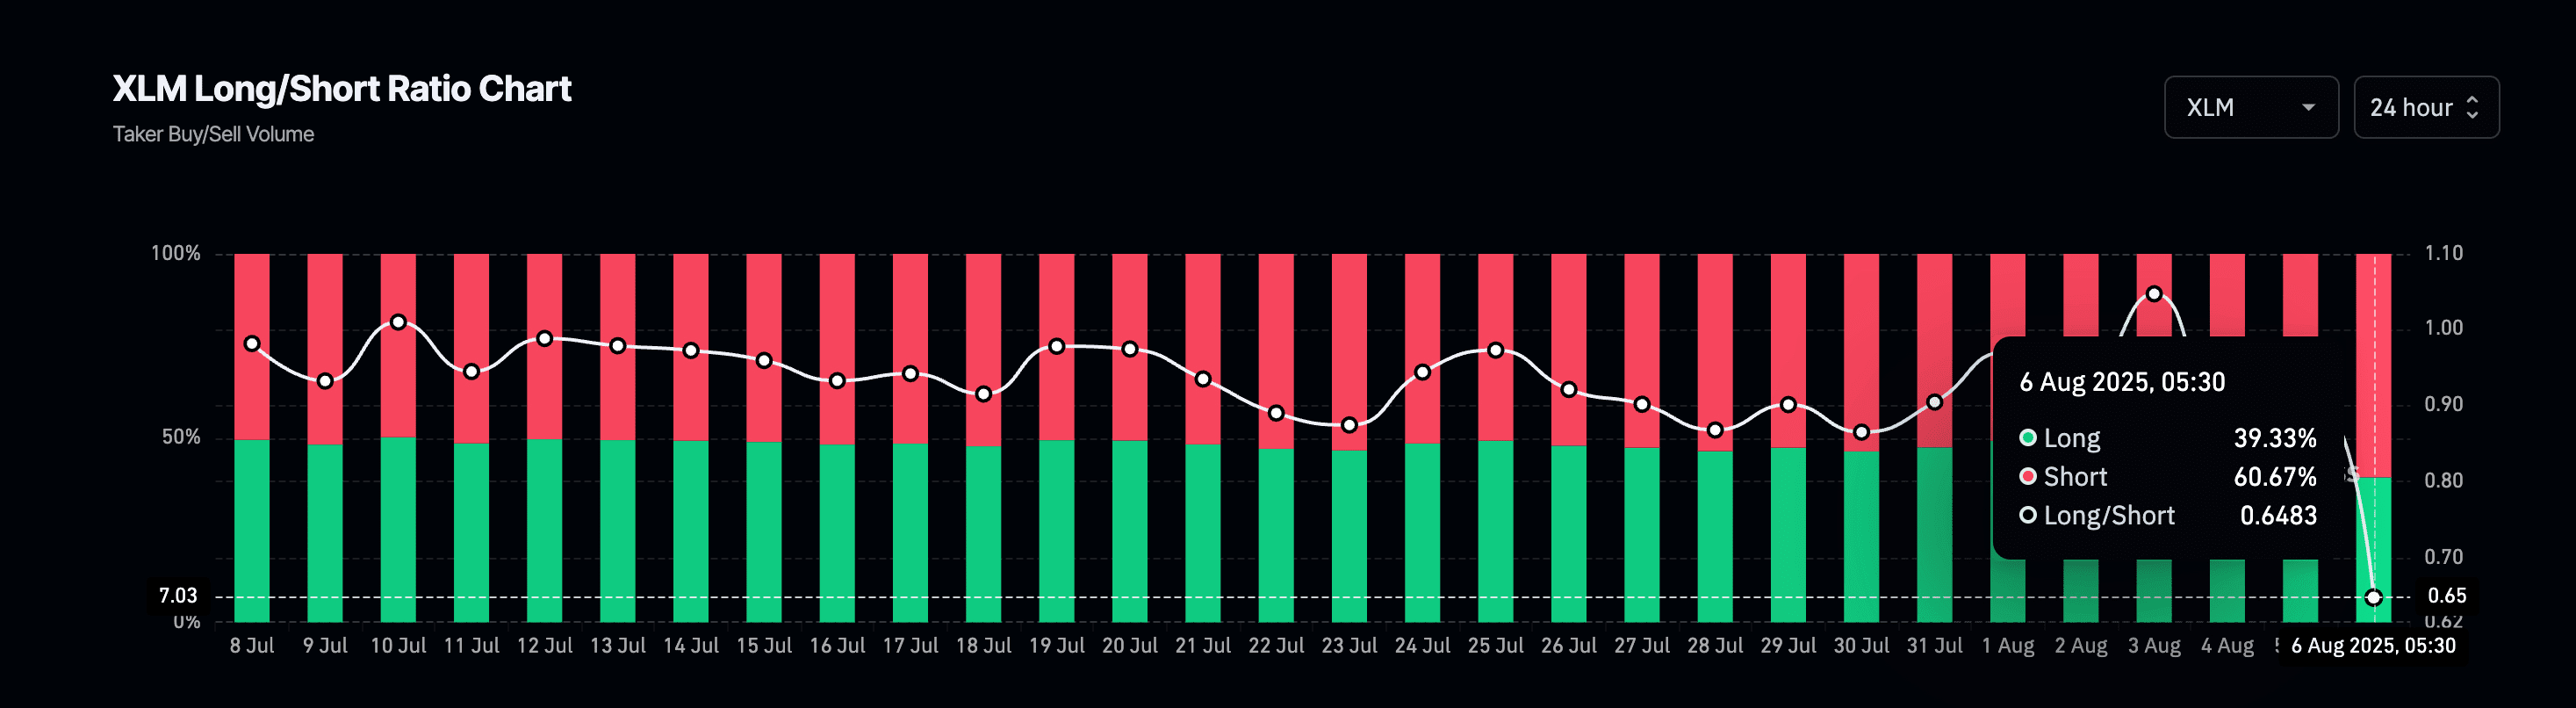
The buy/sell ratio shows the number of traders betting on price increases (buying) versus decreases (selling). A high sell ratio means the majority expect the price of XLM to decline.
Support levels to watch as the price of Stellar (XLM) swings at the breakout.
The price of XLM is currently trading at around $0.38, just above the short-term support area at $0.37. A drop below $0.37, followed by a drop to $0.33, is likely to trigger further selling.
If the level of $0.33 does not hold, the price of Stellar may return to $0.28. Any drop below this level will confirm a complete breakdown in momentum.
If the bulls can maintain the $0.37 level and push the price of XLM above $0.40 and $0.45, there will still be hope for recovery. However, surpassing the $0.40 level will invalidate the short-term decline hypothesis.
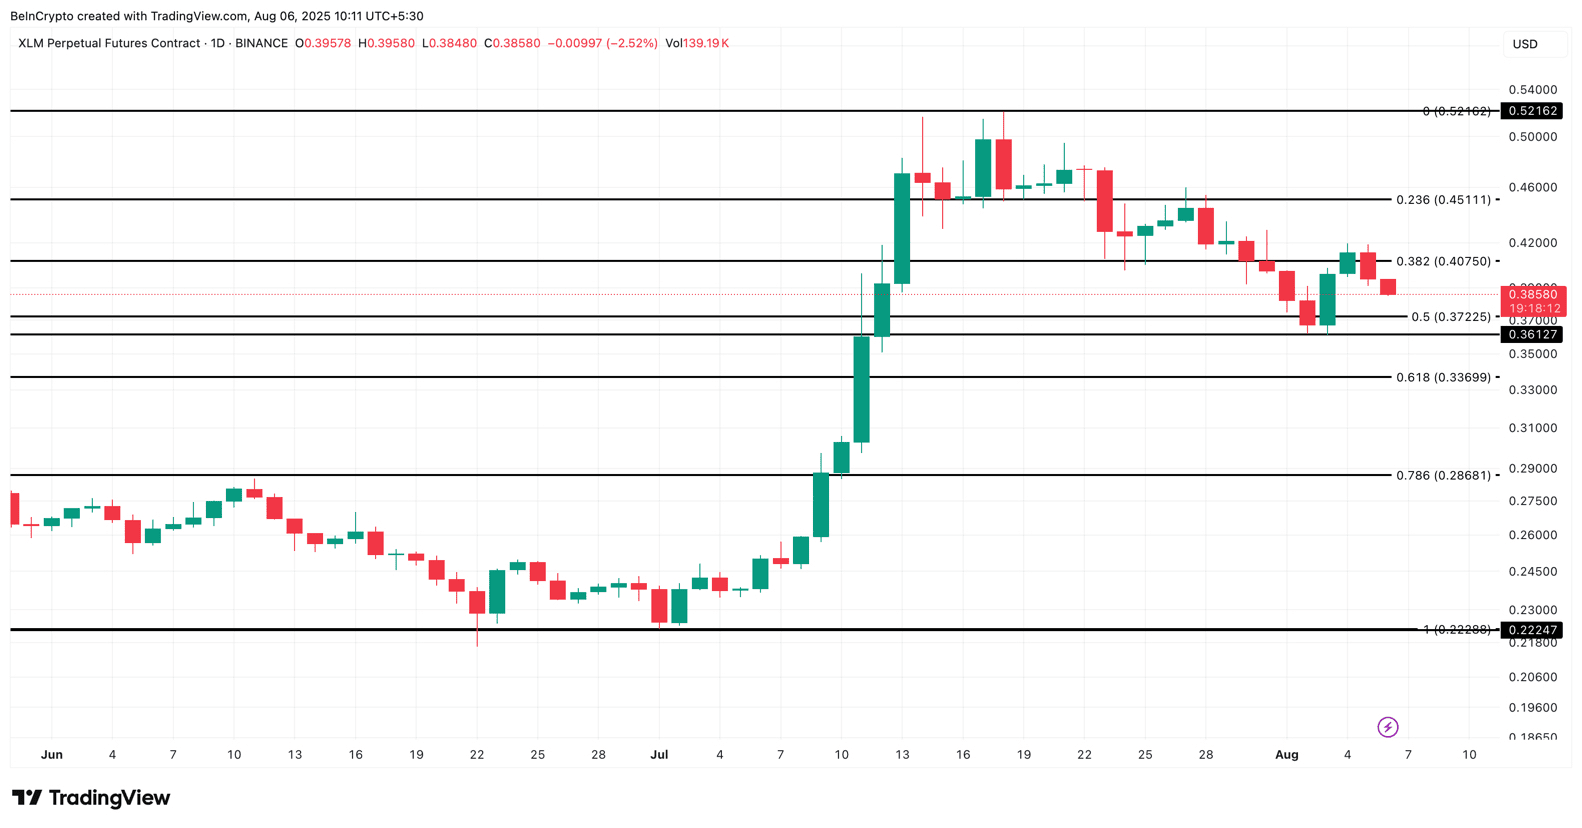
The real test lies at $0.52. A clear breakout above this resistance level alone is enough to confirm a new bullish trend. Until then, the structure of Stellar (XLM) remains fragile.
