1.
There have been many discussions about price action, but does it feel somewhat theoretical? Many friends say there are countless trading systems, but execution determines the final profit curve of the trading system. So what is a trading system? How to execute a trading system?
I have also said that one should break free from the constraints of indicators. Indicators are consensus, and consensus is often hard to be effective because the market is counter-intuitive.
But today we will discuss a trading system that is straightforward and effective.
This is a simple strategy from the cryptocurrency world by a semi-god. This is a trading method previously revealed by a semi-god in the crypto world, with an incredibly high win rate. It is also a method I use for small contract trades for fun, with a win rate that is quite good, achieving an astonishing win rate of over 90% in 100 consecutive trades (as long as one is not greedy).
"I treasure being non-greedy, while you treasure jade; if you compete with me, you will lose your treasure."
Semi-god, this name should be familiar to old friends in the cryptocurrency world. He started with a capital of 10,000, forging ahead in the market waves. At his peak, he achieved more than 400 times profit purely through real trading. This achievement is enough to make many investors look up in envy. By the time he chose to exit the market, his assets had accumulated to nearly 50 million.
Now I will demonstrate how this system achieves over 90% win rate in 100 trades, and what you need to do now is to quickly like, save, and follow.
2. Indicator settings
This trading system only uses two free TradingView indicators. Friends who do not use TradingView need not worry; these two indicators can be found in many software. The overall interface looks something like this:
The first indicator used is MACD.
Bar chart, the underlying logic of MACD will not be discussed here. We will only look at its usage.
The principle is simple: when the upward or downward trend is strong, the peaks of the MACD histogram will become very high or very deep. When momentum weakens, the peaks of the MACD histogram will shorten.
In this system, MACD plays a crucial role in verifying the continuity of price movements. To capture trading signals, we will closely monitor the dynamic changes in the MACD histogram, especially patterns of continuous increases or decreases.
It is worth noting that this is related to divergence.
The concept has a similar essence. However, success often depends on a little-known detail, which is unfamiliar to most investors. When searching for divergence signals, be sure to pay attention to the significant gaps between peaks. This type of continuous and significantly differing peaks often contains richer trading opportunities.
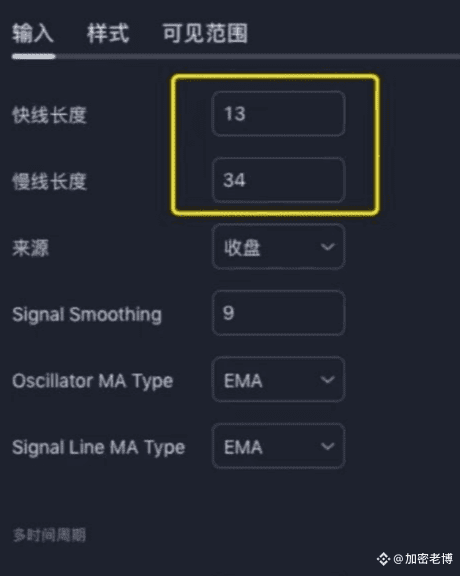
Setting One:
We set the length of the fast line to 13 and the length of the slow line to 34, completely canceling the golden cross and death cross as they are of no use.
As shown in the image below:
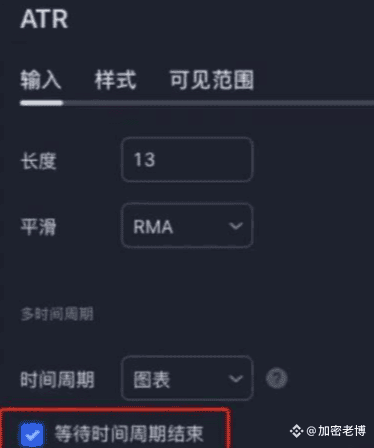
Setting Two:
The second indicator used is ATR.
In this system, it is used to calculate stop-loss points. We set the parameters to 13.
It’s that simple. The above indicates all the indicators of this trading system, which has clear and distinct entry and exit points. Anyone can accurately judge when to enter and exit. Next, we will combine specific examples to see the actual operational effectiveness of this system.
3. Indicator usage
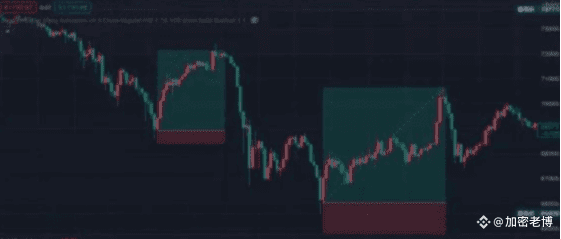
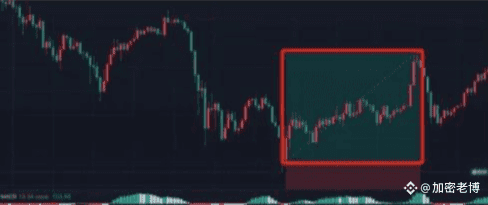
This is a 15-minute level chart of Bitcoin:
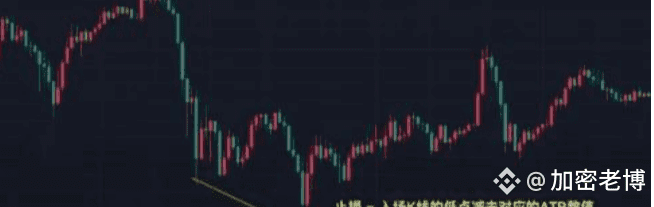
Step Four:
1. First find two or three MACD peaks that differ significantly and are continuously rising.
2. Next, find the candlestick corresponding to MACD and see if the low points of the candlestick are continuously decreasing.
3. The solid MACD bars are converted into hollow ones, with the first bar corresponding to the candlestick serving as our entry candlestick.
4. Use the low point of the entry candlestick minus the corresponding ATR value as the stop-loss point.
If the risk-reward ratio of 1:2 is our profit target, then this trade has already exceeded its task. See the image below:
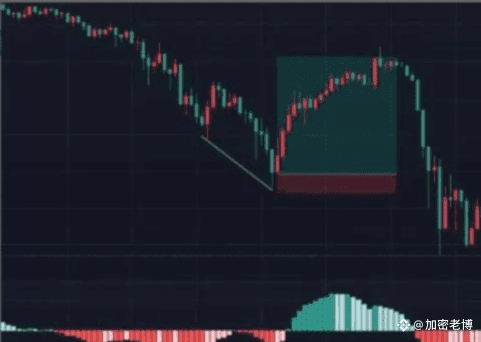
Looking at an example of a short position, the short position must also meet these conditions, see the image below:
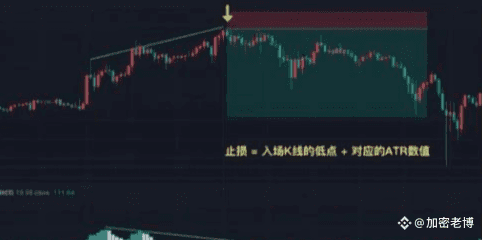
1. First, find the MACD bars with significant differences in peaks that are continuously decreasing above the zero line.
2. Then check if the high points of the candlestick corresponding to MACD are continuously hitting new highs (preferably in a wedge structure).
3. The corresponding candlestick for the conversion of solid MACD bars to hollow bars serves as the entry point.
4. Use the high point of the entry candlestick plus the ATR value as the stop-loss point.
Take profit can also be chosen in batches at risk-reward ratios of 1:1, 1:2, or even higher. You can see that this trade quickly achieved its target.
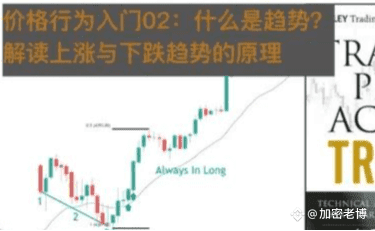
Regarding the second point, I will not elaborate on the principles. Combining with the principles discussed in the article below will be better. Interested friends can take a look.
Kua Cha: Introduction to Price Action 02: What is a trend? Interpreting the principles of upward and downward trends.
Other examples should be backtested by everyone. If you find them good, feel free to come back and discuss.
4. Key points
Key points for opening positions:
The price shows consecutive peaks, two to three.
The MACD histogram shows a clear divergence.
Volume bars signal opening positions.
Stop-loss principles:
Long: Stop-loss = Low point of entry candlestick - corresponding ATR value.
Short: Stop-loss = Low point of entry candlestick + corresponding ATR value.
There is another indicator that can be used. Considering that not all friends can use TradingView, the two indicators used in this article can be found in many software. Friends using TV can add 'divergence for many indicators V4' in the indicators, as shown below:
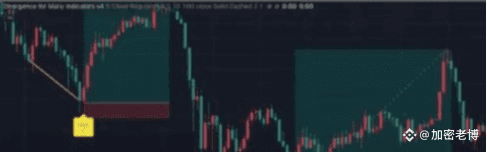
Automatically helps you find divergences, making it more convenient.
Finally, it is important to note: although the success rate is very good, it also reached about 70% under a risk-reward ratio of 1:2. The win rate can exceed 90% at a risk-reward ratio of 1:1.5. As for higher risk-reward ratios, you will see them in practice.
Therefore, which take-profit method is most suitable for you, please consider for yourself. Take-profit can be done on the right side, letting profits run.
The most important thing is:
Strictly set stop-loss!
Strictly set stop-loss!
Strictly set stop-loss!
Don't get too excited! Don't get too excited! Don't get too excited!
This strategy is a counter-trend trading strategy. It is unrelated to price action theory, although one could say that the divergence seen in wedge patterns eventually leads to this kind of divergence.
If you are considering adopting this trading system, conducting a comprehensive market test is undoubtedly an essential step.
Through testing, you can find the trading variety that is most compatible with this system, ensuring the system's maximum effectiveness.
Participating in actual trading only after thorough understanding and preparation will be a wise move in terms of being responsible for your funds.
The old blogger only does real trading. The team still has spots available, so hurry up.