
XRP has yet to recover, but it is hovering around the $3 mark, maintaining a 35% monthly gain. However, last week wiped out more than 5.3% of this gain. This leaves traders uncertain whether a breakout is imminent or another downturn is approaching.
And with August typically being volatile for XRP, the price is at a critical moment, as everything hinges on the behavior of traders and whales around the $3.00 mark.
Exchange Flow and Liquidation Map Suggesting Short Setup
One of the main reasons XRP hasn't seen a strong price surge is the increasing selling pressure on exchanges. Net money flow has started to increase again, particularly after July 30, when the price nearly hit $3.00.
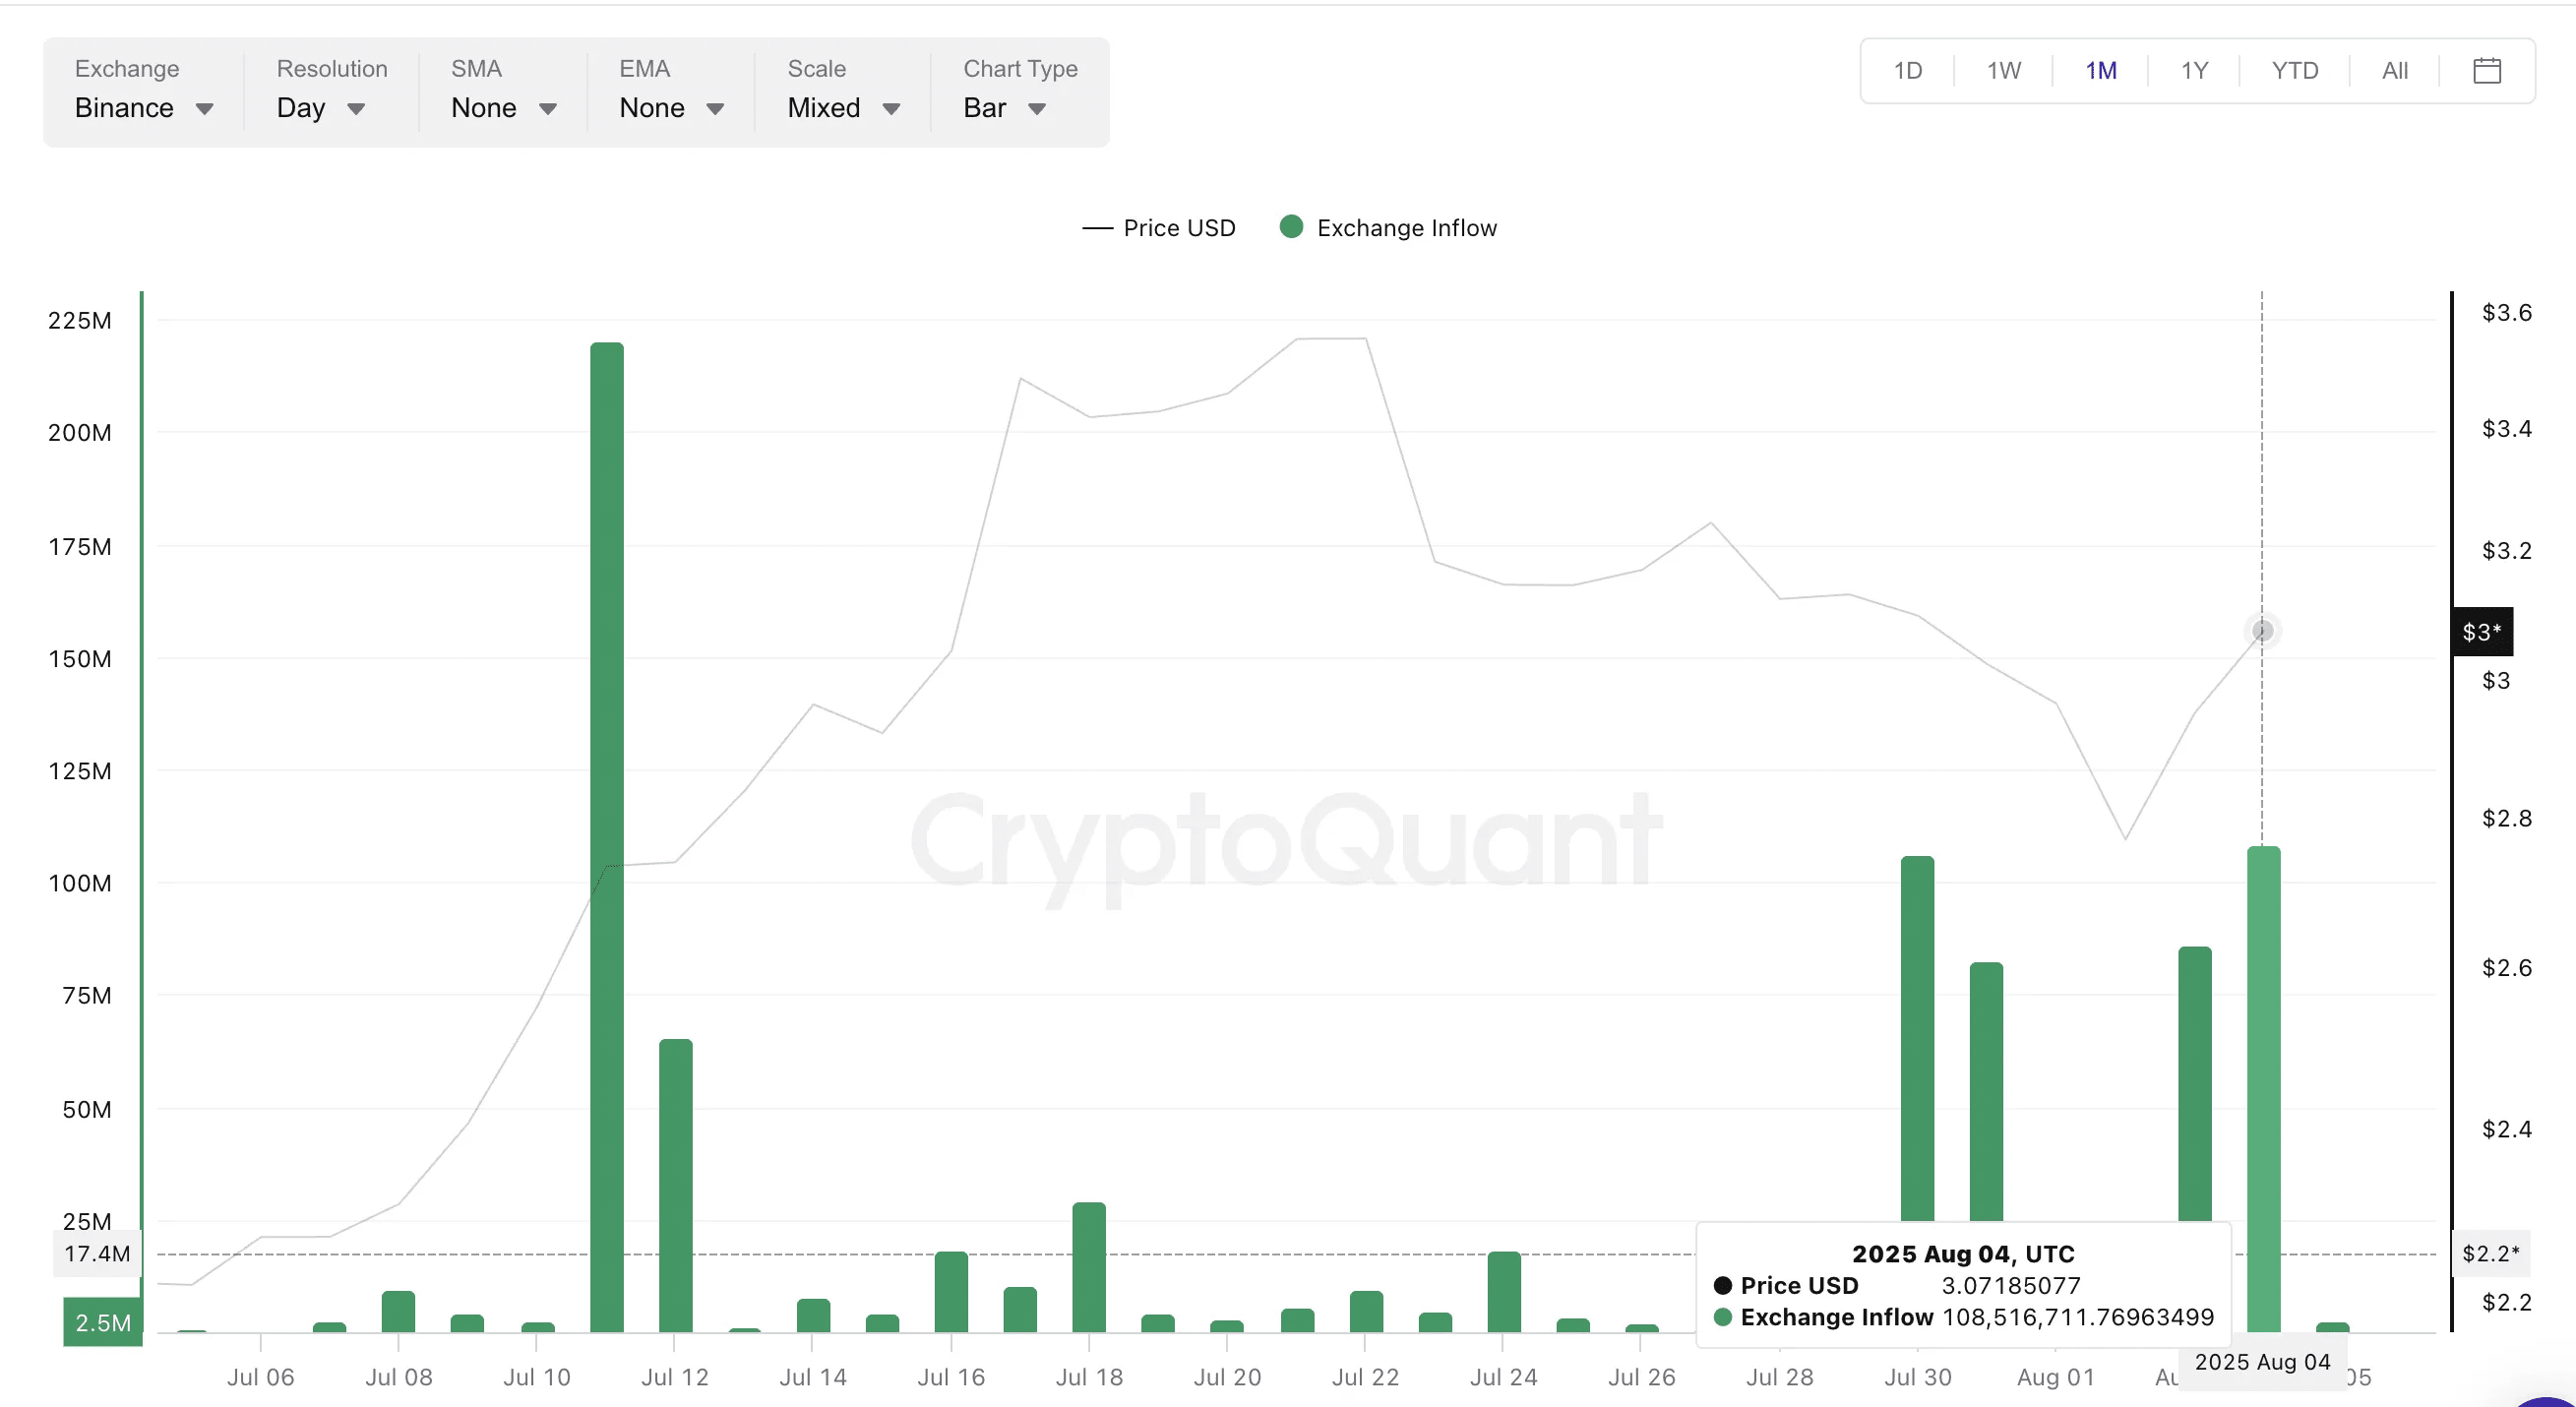
A similar move occurred on July 11, when inflows to exchanges surged to over 220 million XRP. At that time, the price did not immediately correct. Instead, it rose above $3.60, and only later did the selling pressure catch up. This suggests that traders are positioning to exit near the top, keeping funds on exchanges without selling immediately.
Back to the present: money flow is increasing again, suggesting that traders may be ready to sell if XRP rises above $3.00. However, despite this bearish trend, the liquidation map tells a different story. It may indicate when the actual sell-off will begin.
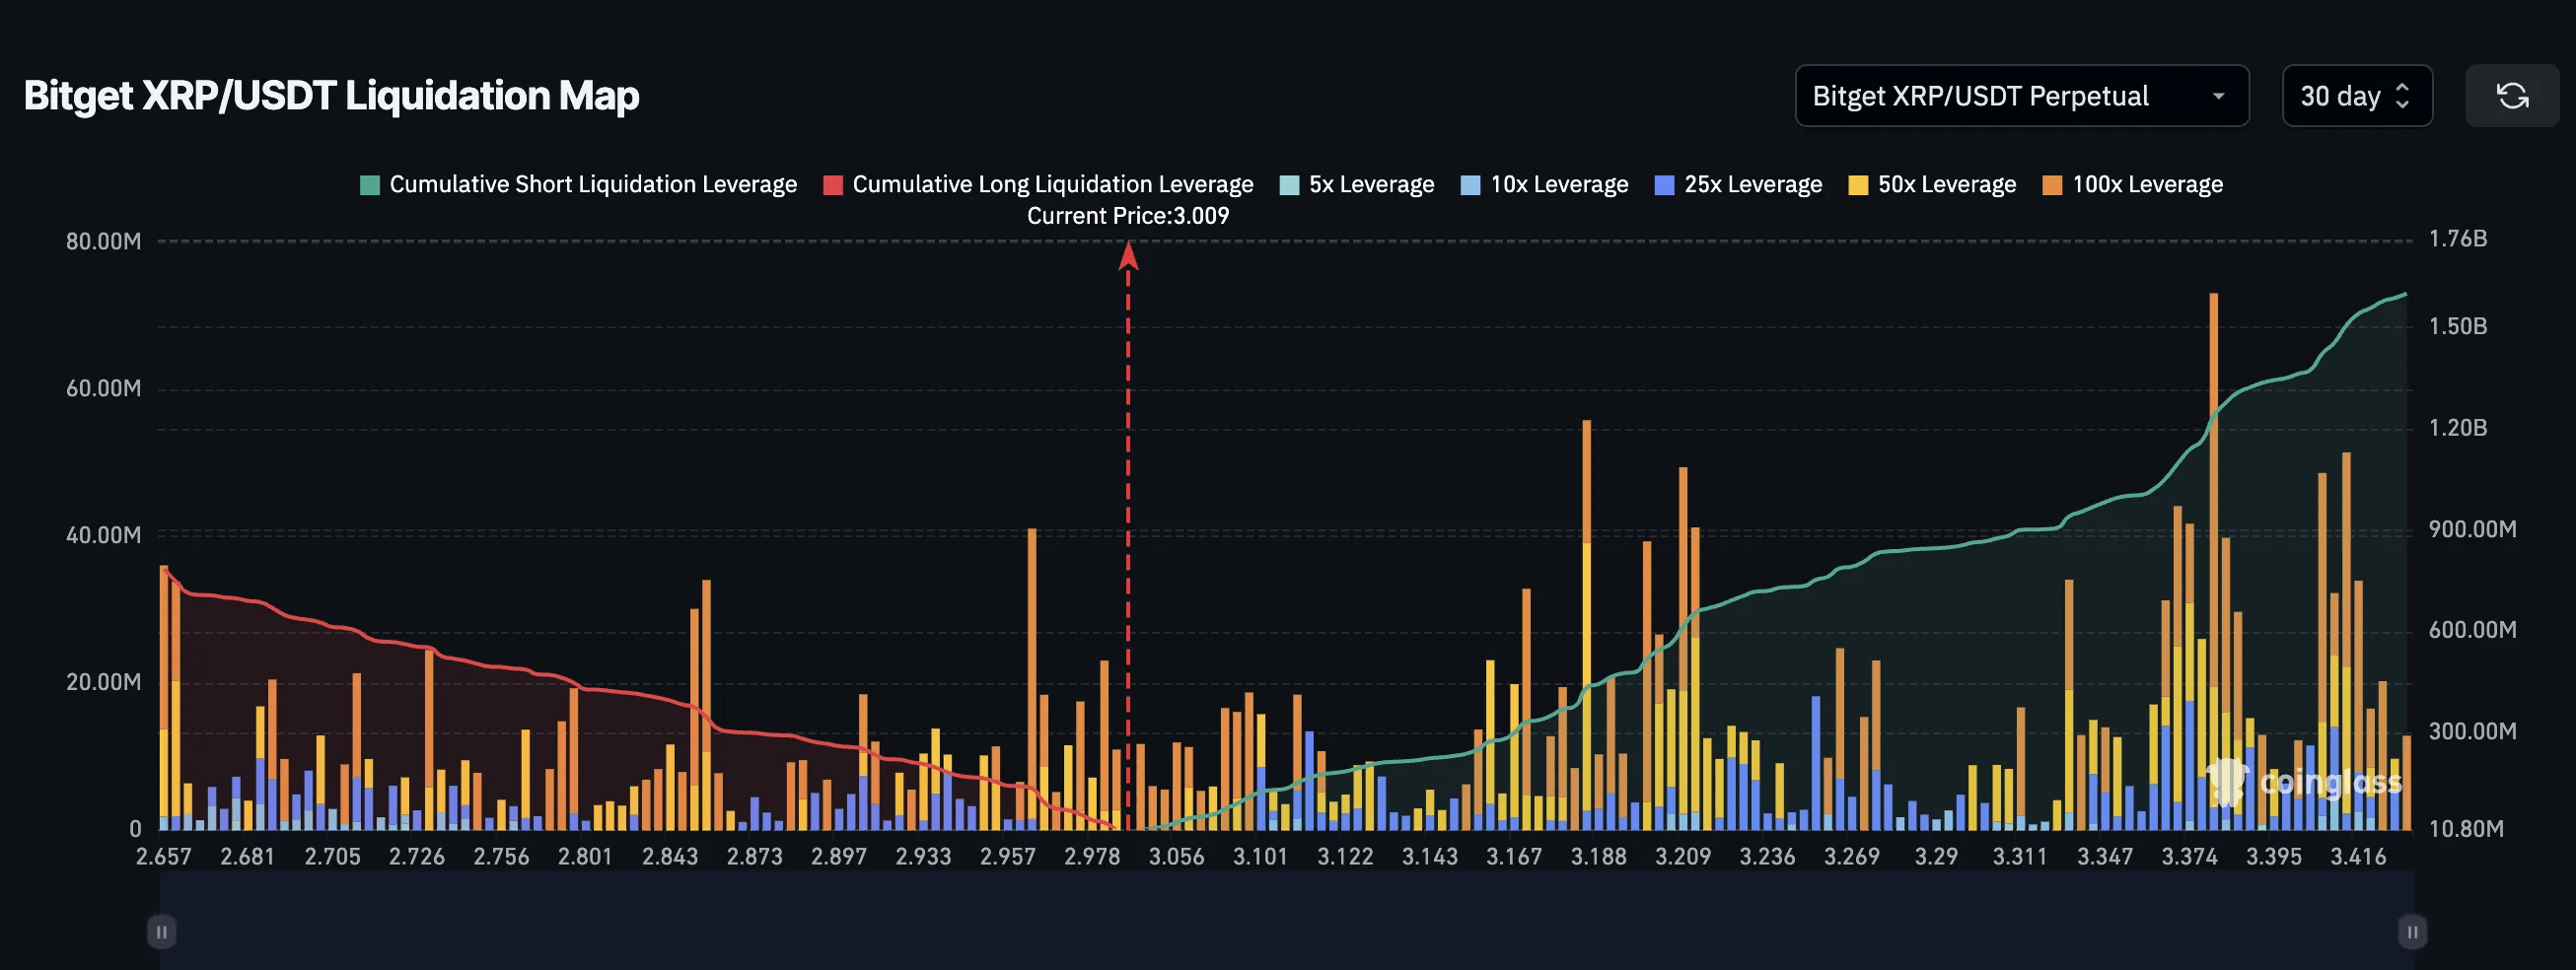
XRP liquidation data from Bitget shows that the market is still heavily tilted towards short selling. The total value of short positions reaches $1.6 billion, while buy orders are only at $784 million. This imbalance means that a sudden price surge could liquidate a significant amount of short orders, creating a classic short squeeze. With the current price around $3.00, a price increase of 10% to 14% could trigger a short squeeze up to $3.40.
Note: A similar event occurred from July 24 to July 27 when the price of XRP surged from $2.95 to over $3.30 without a clear reason. While this raises suspicions of price manipulation, the possibility of a similar event cannot be ruled out.
Are Whales Driving Movement or Sitting on the Sidelines?
Interestingly, whales may also play a role in driving this move. Data from the money flow from whales to exchanges shows that large investors have been selling off aggressively during recent price increases. On July 30, whale inflow surged to over 55,000 XRP, the highest in a month, when the price of XRP dropped below $3.00. Again, on August 3, inflow hit 38,226 XRP when the price was close to $3.00.
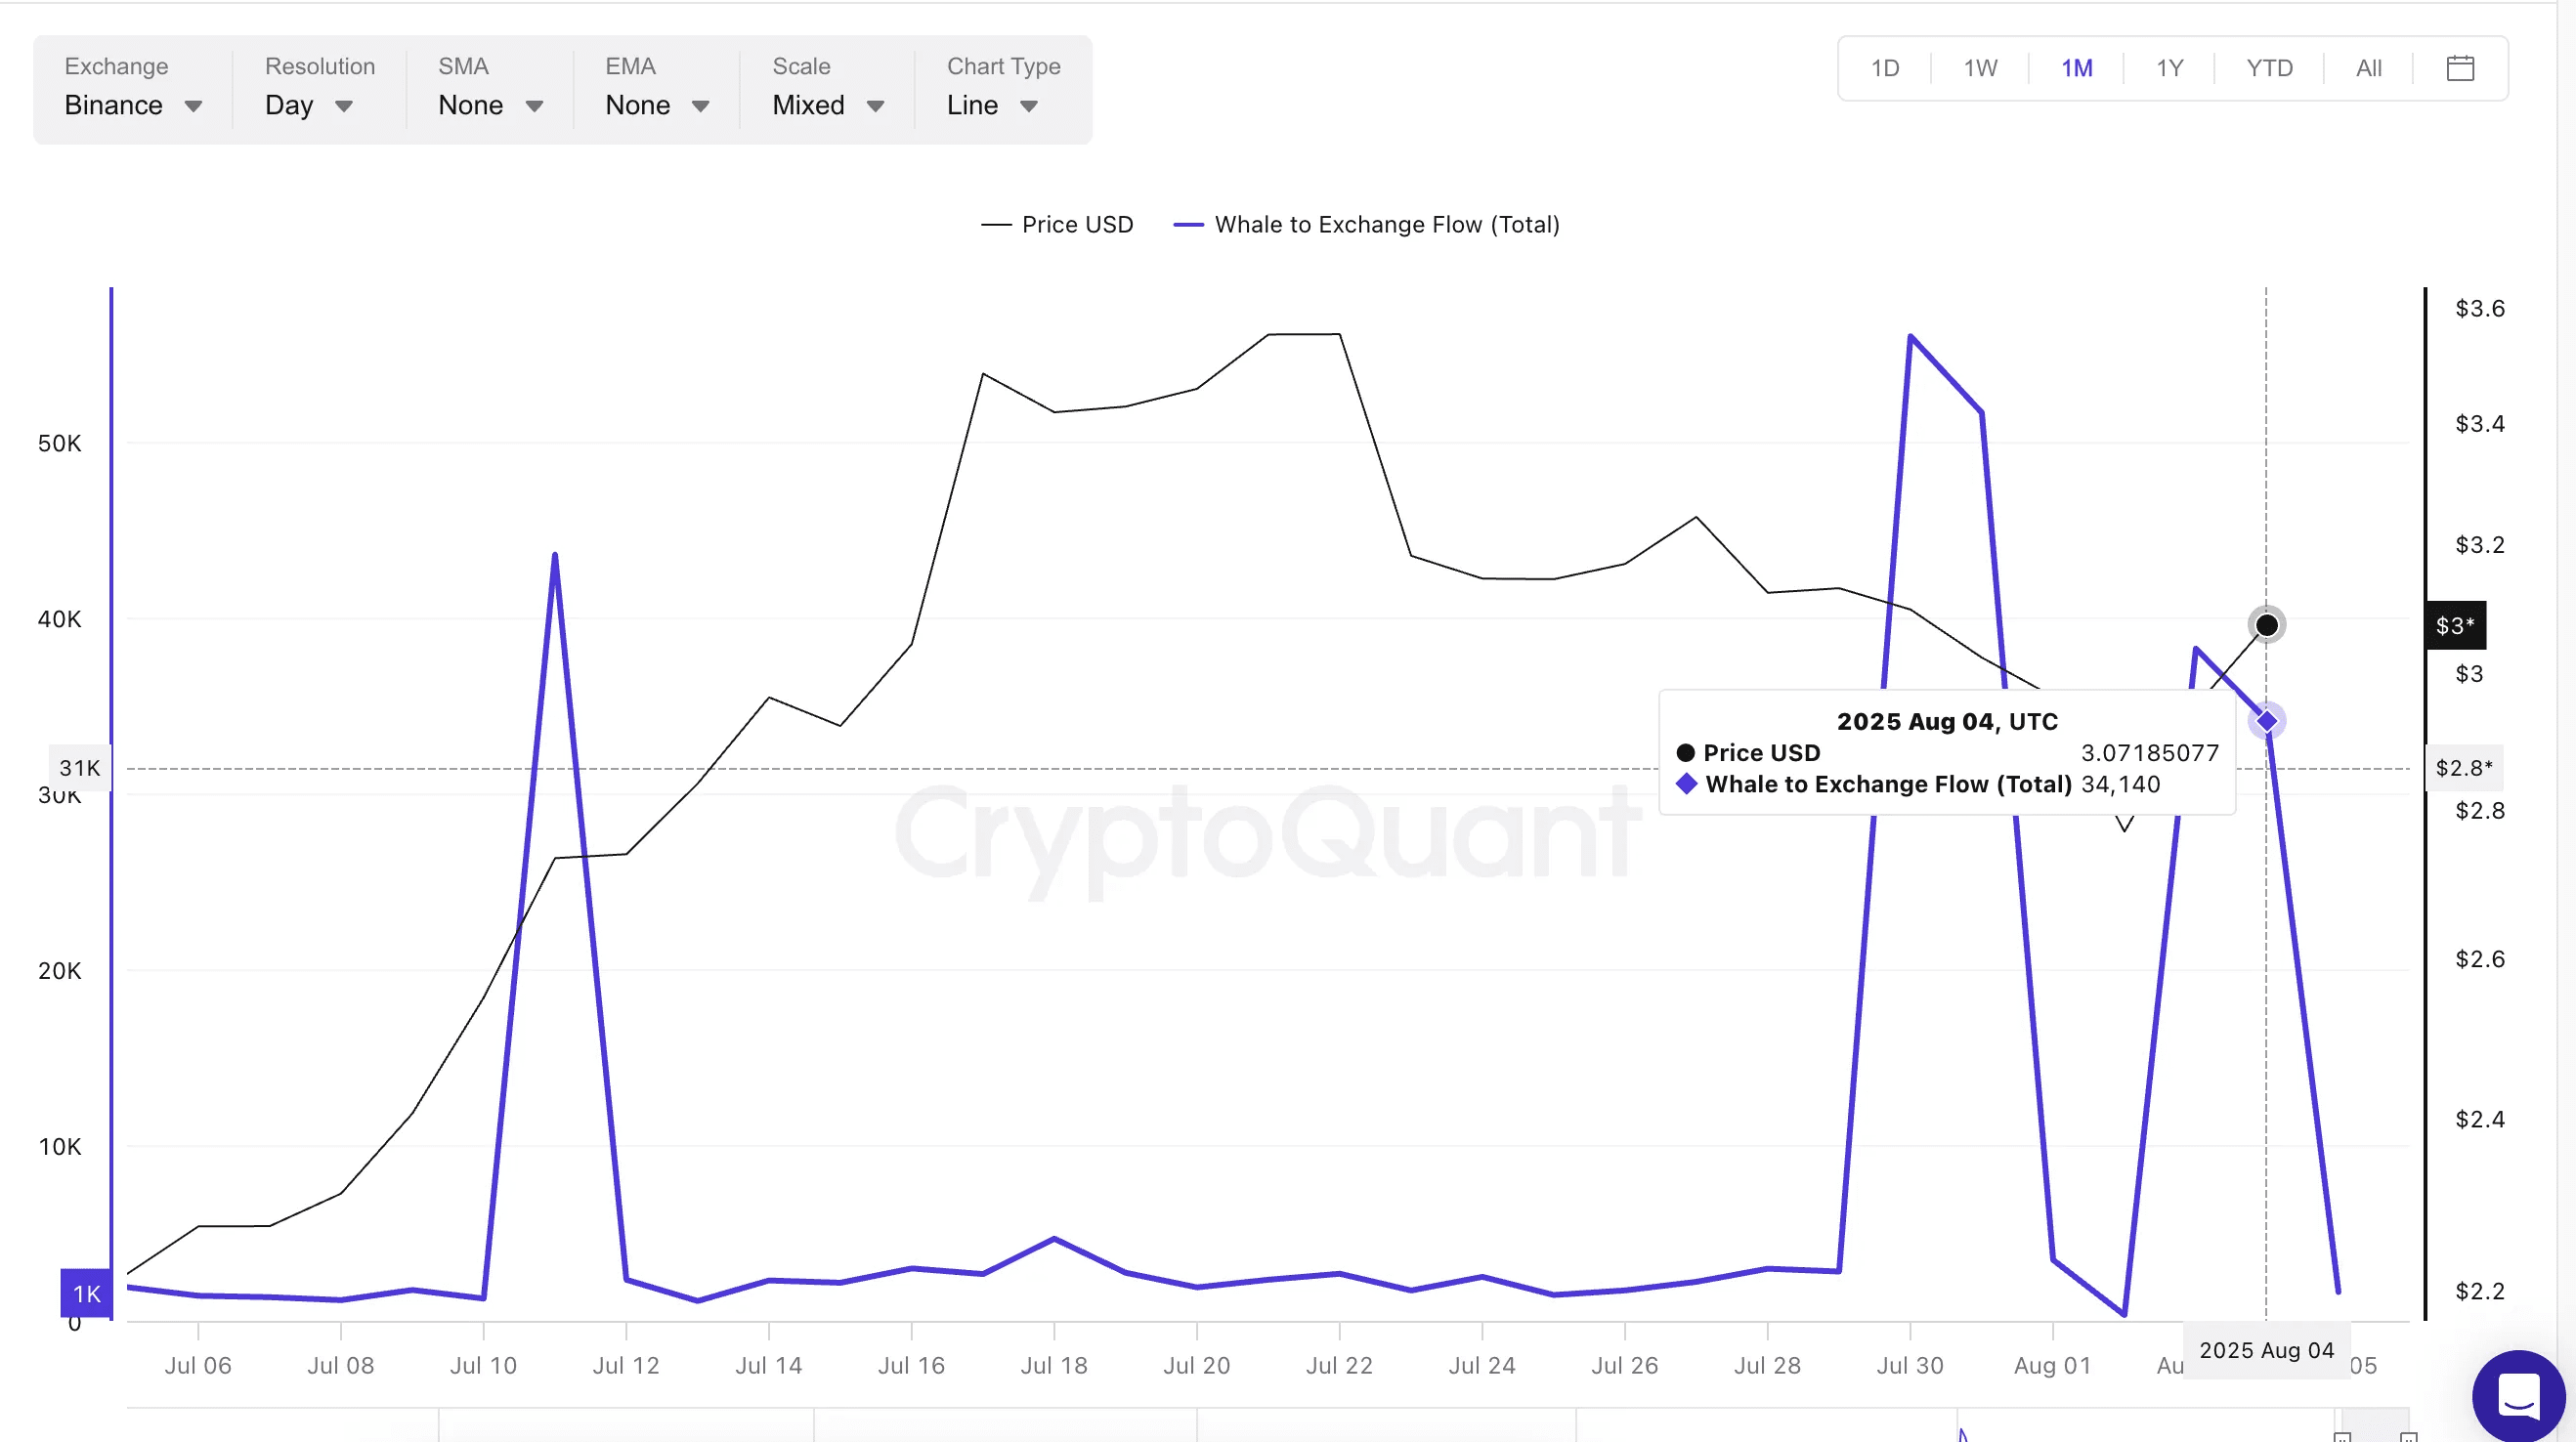
But since then, inflow has decreased to 34,140 XRP on August 4, even as the price of XRP remains above $3.00. This indicates a divergence: while the price increases, whales are sending fewer tokens to exchanges. This could mean they are cautiously observing. Or it could also mean that the selling pressure led by whales has finally eased. Both signals appear optimistic for XRP's price in the short term.
However, if whale flow increases again near the $3.08–$3.30 range, it could create enough selling pressure to prevent a short squeeze move. Traders should closely monitor whale behavior before expecting any sustainable price increases.
The transaction flow from whales to exchanges tracks the number of tokens that large holders (whales) send to centralized exchanges; a large volume often signals a selling intention, while lower transaction flow may mean whales are holding.
XRP Price Model Heading Towards Important Breakout Zone at $3.30
The current price structure of XRP is within a falling broadening wedge pattern, a chart pattern often seen before bullish breakouts. This pattern is defined by two diverging downward trendlines, with the price oscillating between them. XRP is currently approaching the upper trendline of this wedge pattern, and a breakout above $3.19 will likely propel the price towards $3.30.
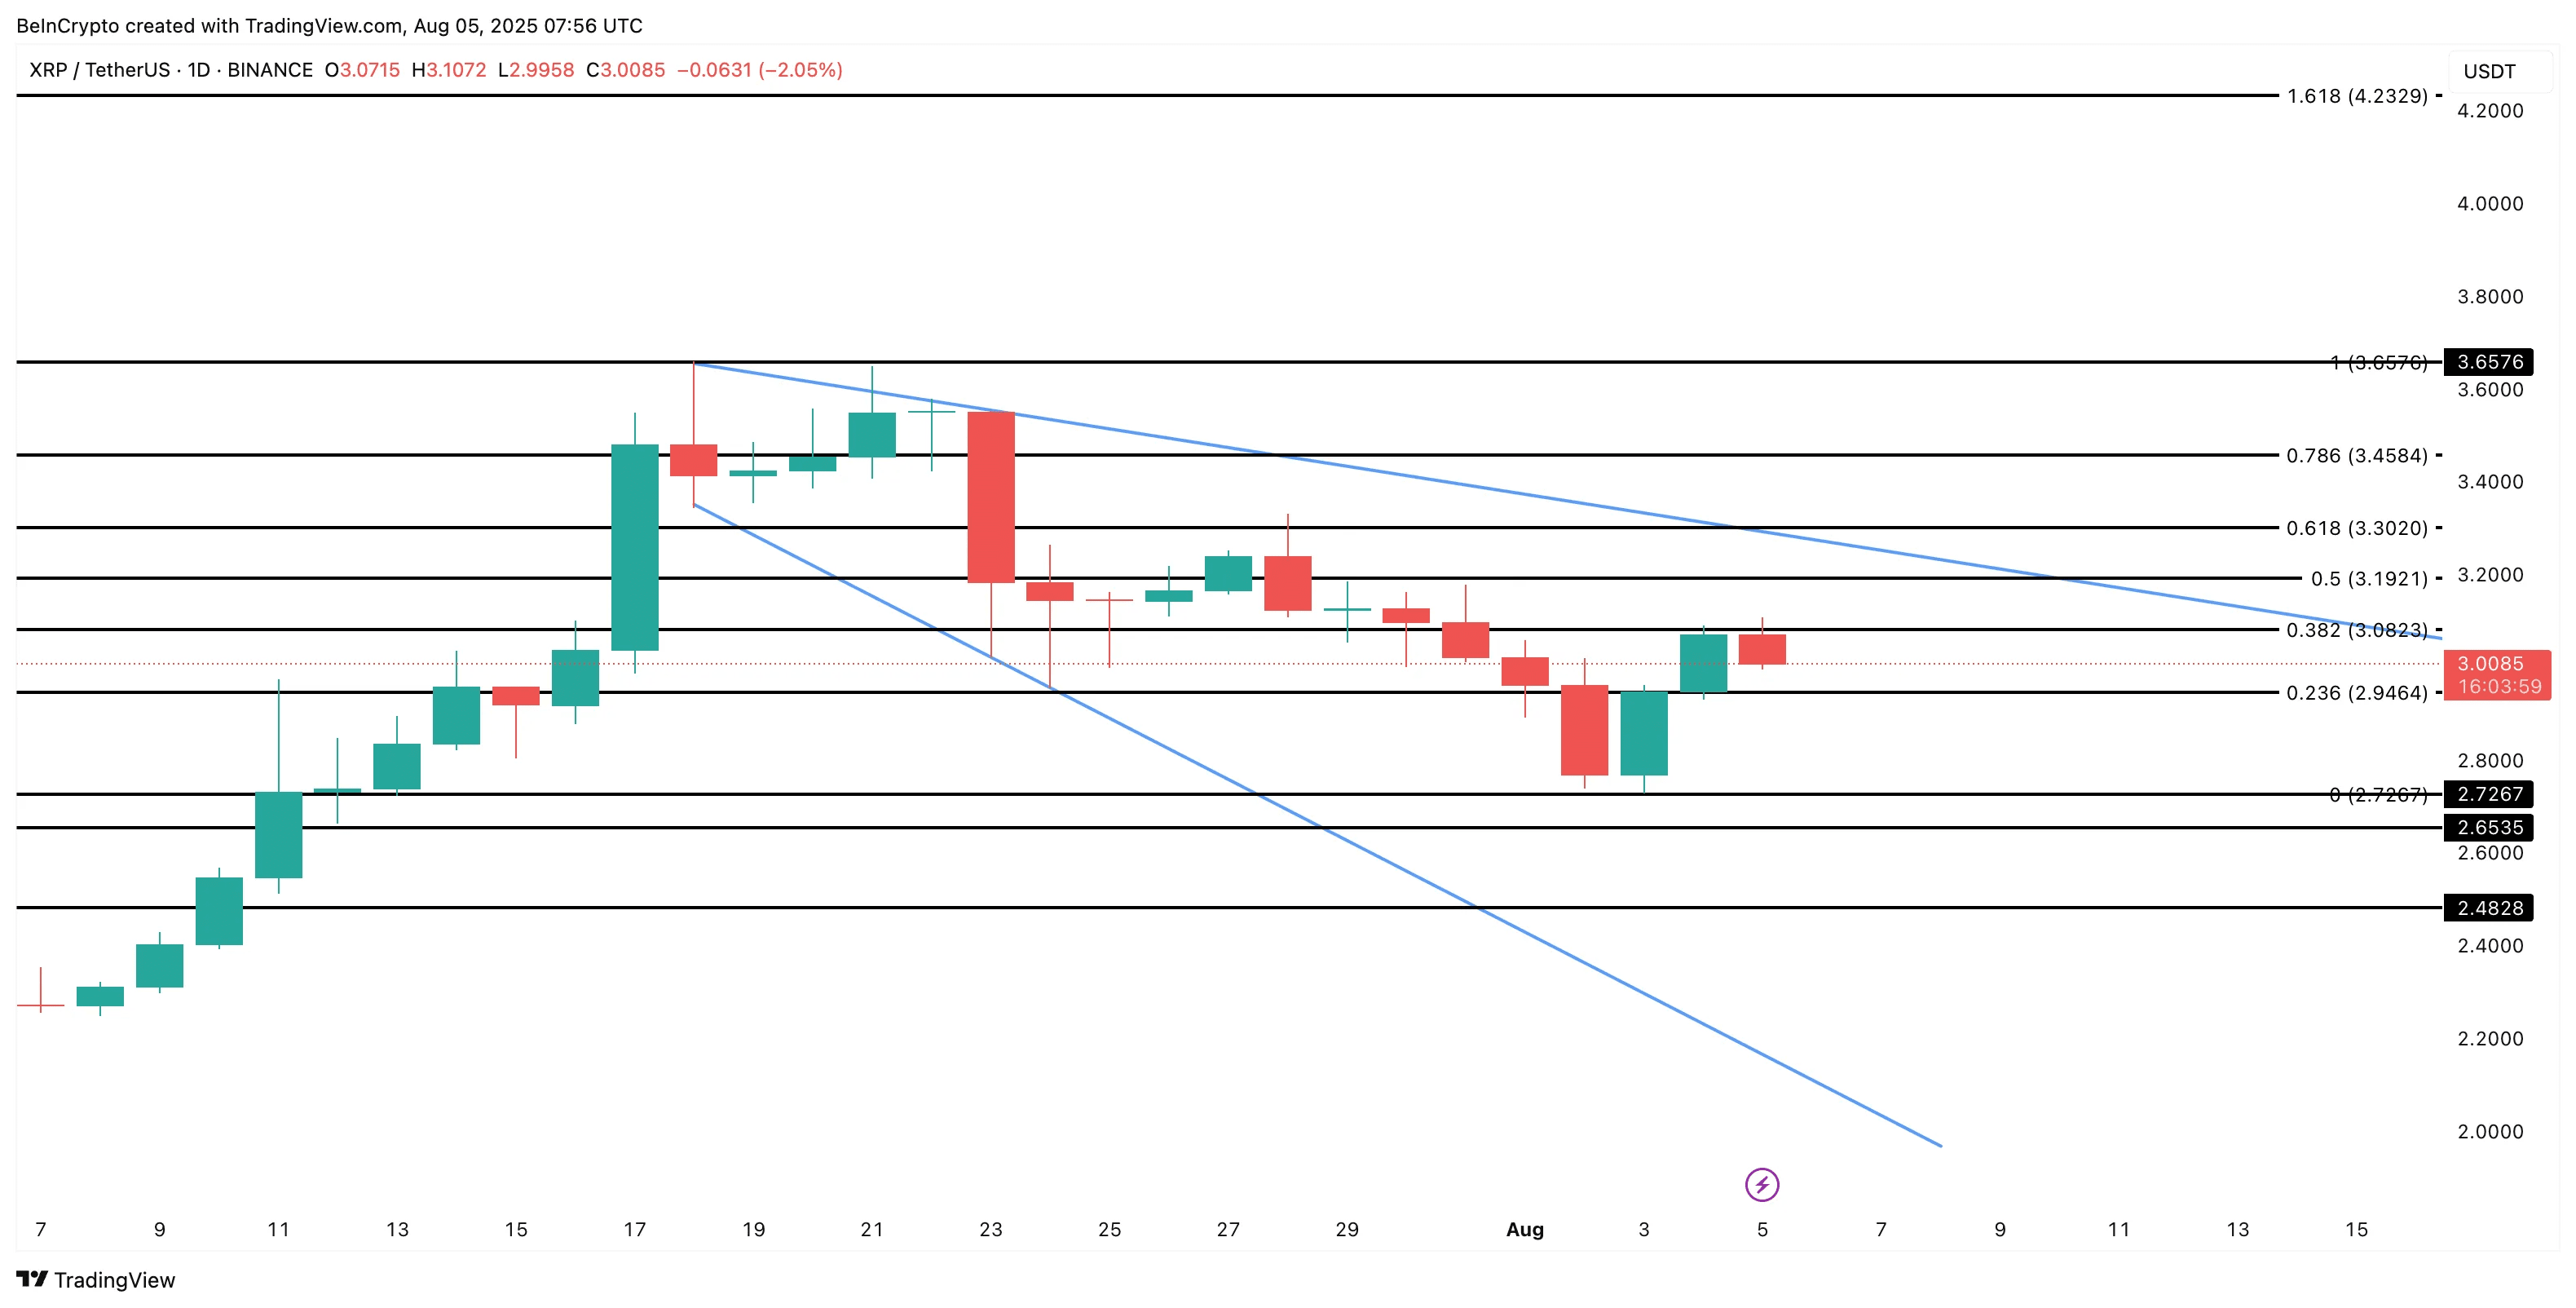
The $3.30 level is not just a round number. It aligns with an important Fibonacci retracement level and coincides with a significant cluster of liquidations. If XRP surpasses this milestone, it could trigger a wave of liquidations, paving the way for a stronger breakout. Until then, fluctuations between $3.00 and $3.30 should be seen as part of a potential squeeze, rather than a full-fledged price increase.
A price surge could occur if XRP surpasses the $3.45 level, an important Fibonacci target. At this price point, all short positions according to Bitget's chart would be liquidated. Until then, the story of short selling will continue. However, if it fails to hold above $3.00 and drops below $2.72, the bullish trend will be invalidated, potentially leading to larger losses.