
Navigating DeFi feels more like an expedition in the jungle than a walk in a garden; it is about self-protection, personal defense. With fake projects launching fraudulent cryptos, and series of memecoins scamming every day, doing your own research (DYOR) is more crucial than ever.
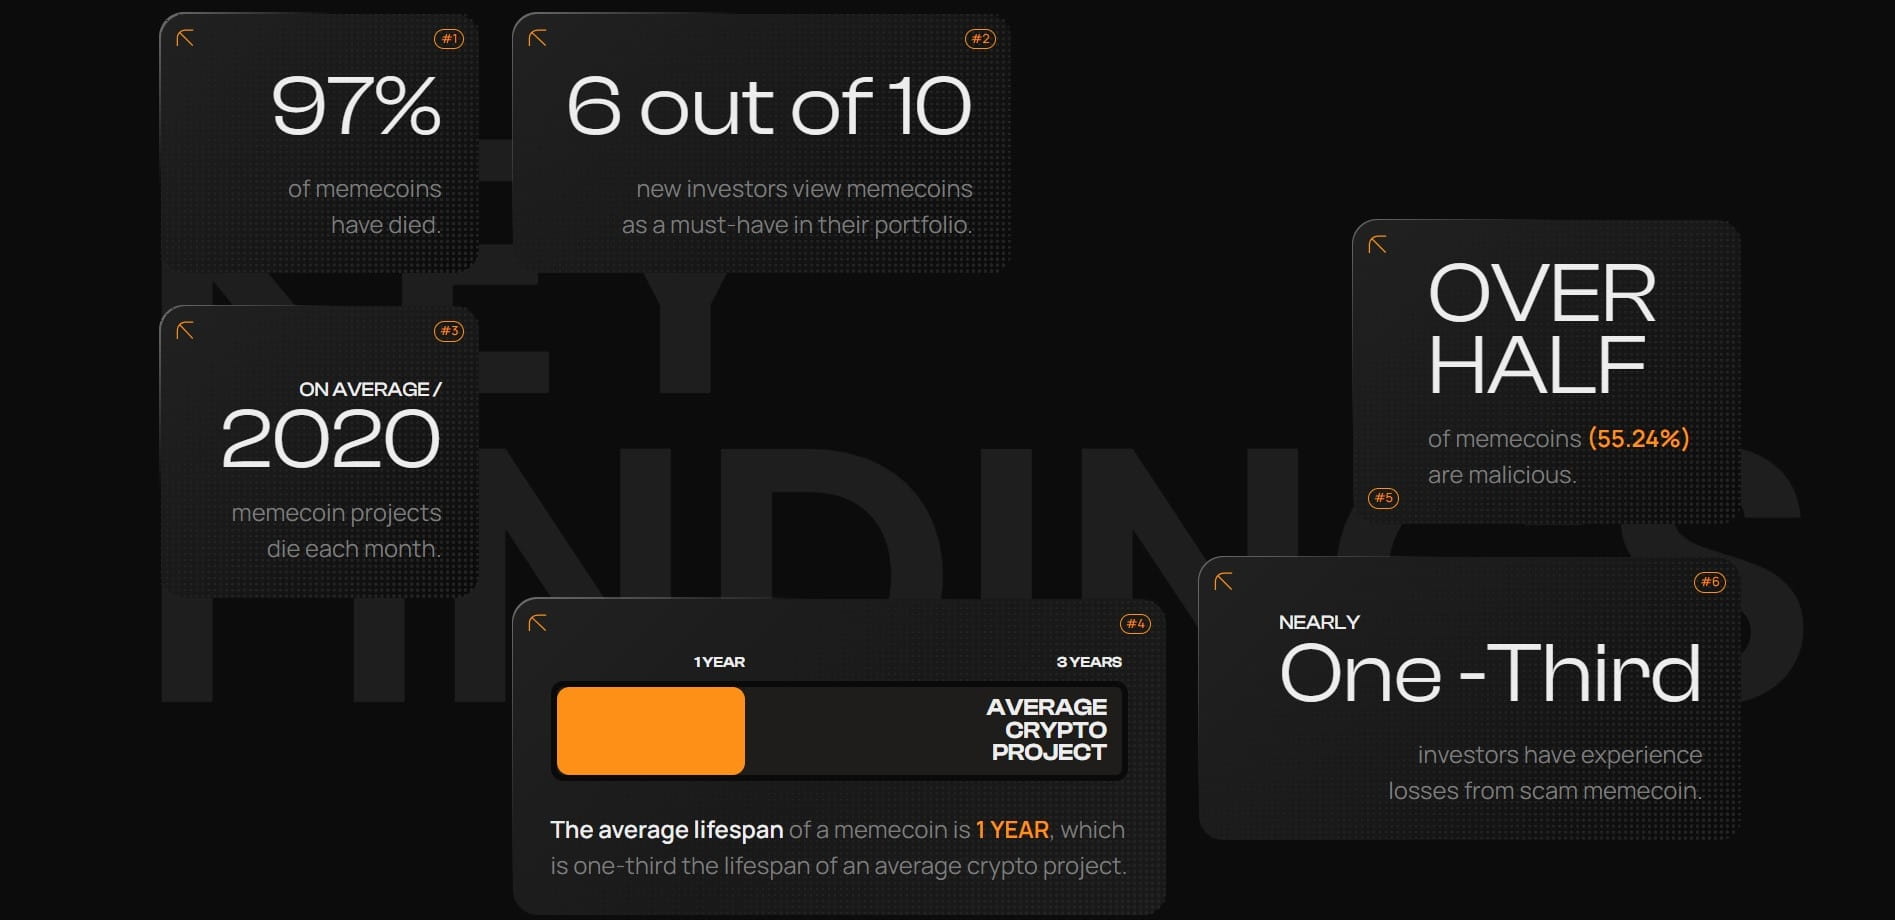
According to a report from Chainplay, 97% of memecoins in 2024 are already dead, with an average of 2,020 memecoins dying each month. This same report indicates that more than half of memecoins (55.24%) show signs of malice such as rug pulls or Ponzi schemes.
Given the high prevalence of scams, understanding what is happening, how it happened, who, when, and how (Investigation) is a matter of survival in this space.
The chaos
Although blockchain data is transparent and open to everyone (Open Source), the data we consult on block explorers is raw and very detailed: alphanumeric addresses, millions of transactions, details about Solidity code, and even binary codes. They do not allow for a direct overall view of what is happening, nor easily spotting anomalies, nor clearly summarizing the state of crypto on a given topic. This makes analysis very complicated and ineffective in crypto investigations – often involving massive blockchain data.
This is where Bubblemaps comes in, transforming this chaos into clear and structured visual intelligence. In reality, what impresses about Bubblemaps goes far beyond, and you will discover why.
Bubblemaps
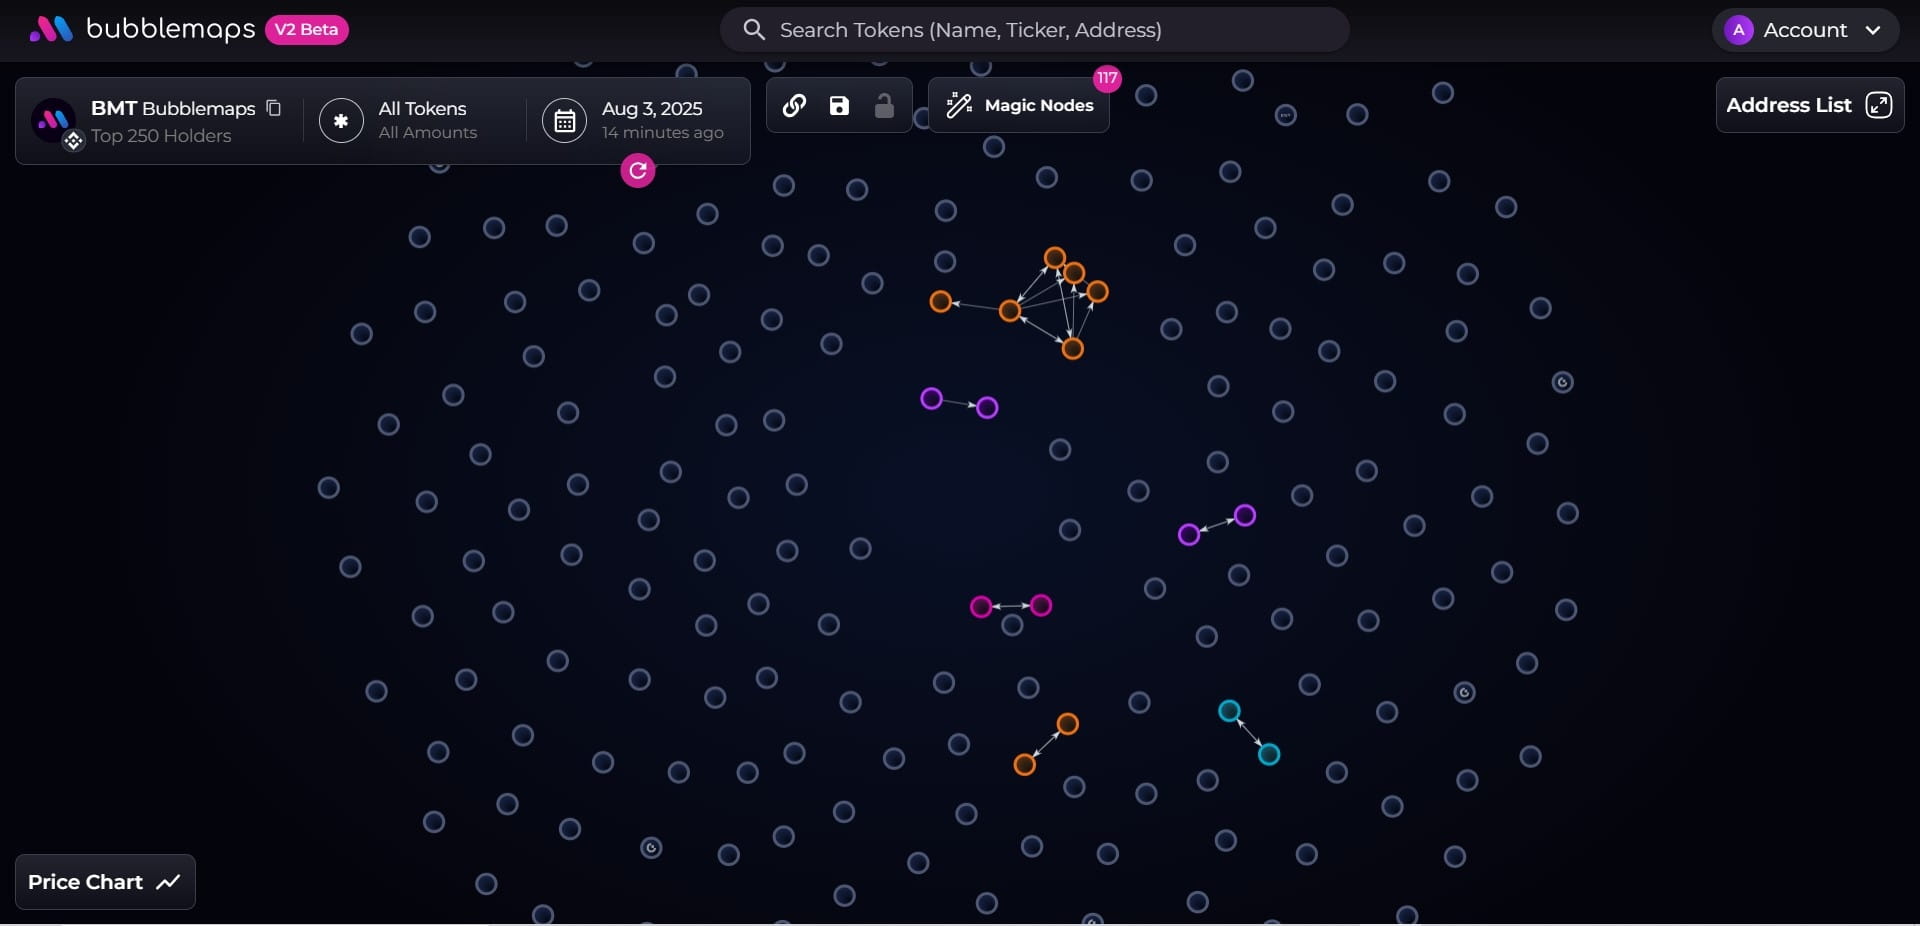
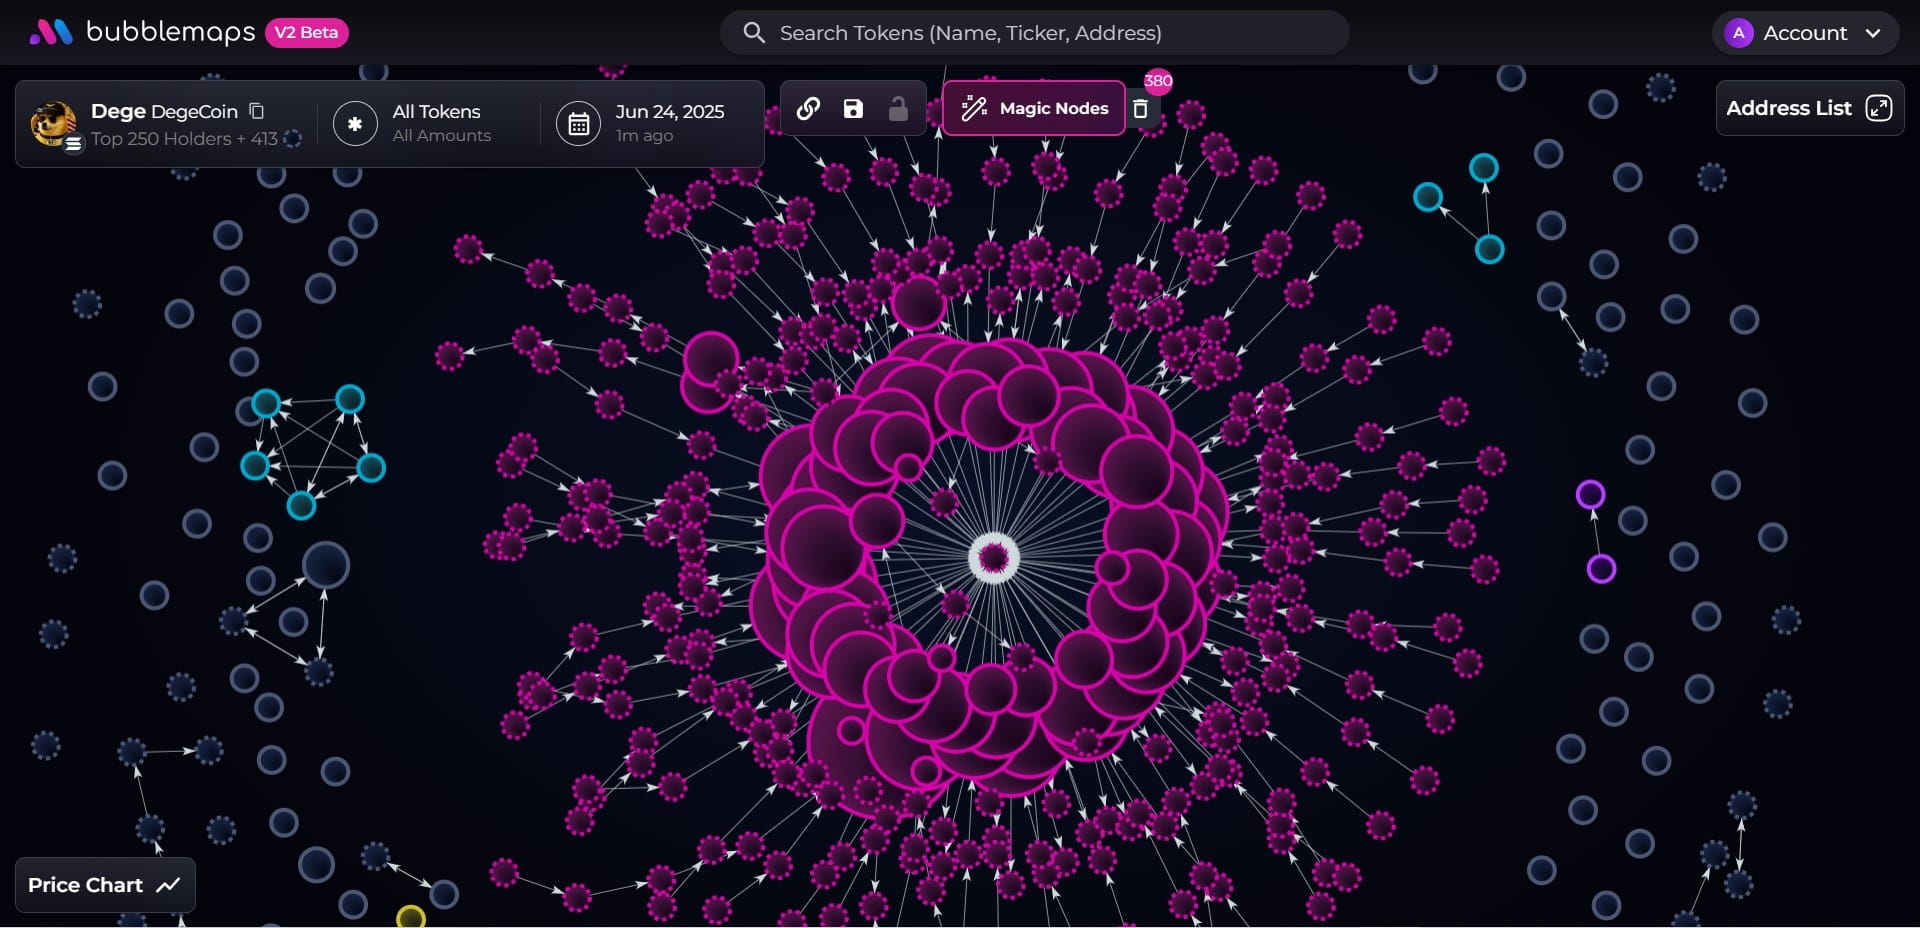
Basically, #Bubblemaps is an intelligence layer on everything happening on the blockchain. It transforms blockchain data into structured visual information, specifically a graphical map and more precisely a bubble map. Understanding the basics of crypto is enough to use Bubblemaps, there is no need to write a whole code to generate a graph; it is easy and intuitive. A bubble map from Bubblemaps would look like this:
Website: bubblemaps.io
The basics
You may be wondering what that changes, but before going further, let's first look at some basic rules of Bubblemaps when investigating a token:
Each bubble represents a wallet
The size of the bubble is proportional to the amount of tokens held by the wallet, meaning that the more tokens the wallet holds, the larger its bubble will be.
The map normally displays by default the top 150 token holders, that is, the 150 wallets holding the most tokens. However, in my recent interactions with the platform, it showed the top 250 holders by default.
The links (lines) between wallets represent past token transfers between the two wallets, and the direction of the arrow is the same as that of the transfer (from whom to whom).
So if there is a transfer history, these wallets (bubbles) would be linked together, highlighting any form of wash trading, wallet manipulation, private sales, pre-sales, giveaways, etc.
A cluster is a group/set/network of wallets linked together, thus allowing for the theory (to assume) that it would be the same entity or group of people behind those wallets; or simply that these wallets know each other, in this case, the holders are friends.
A pattern is a configuration; so in this case, it is the geometric configuration described by the bubbles; in other words, we are talking about the distribution of tokens. Basically, it is the overall scheme described by the wallets.
For more details and information about Bubblemaps, I recommend this very informative article from Binance Academy: link
Investigate
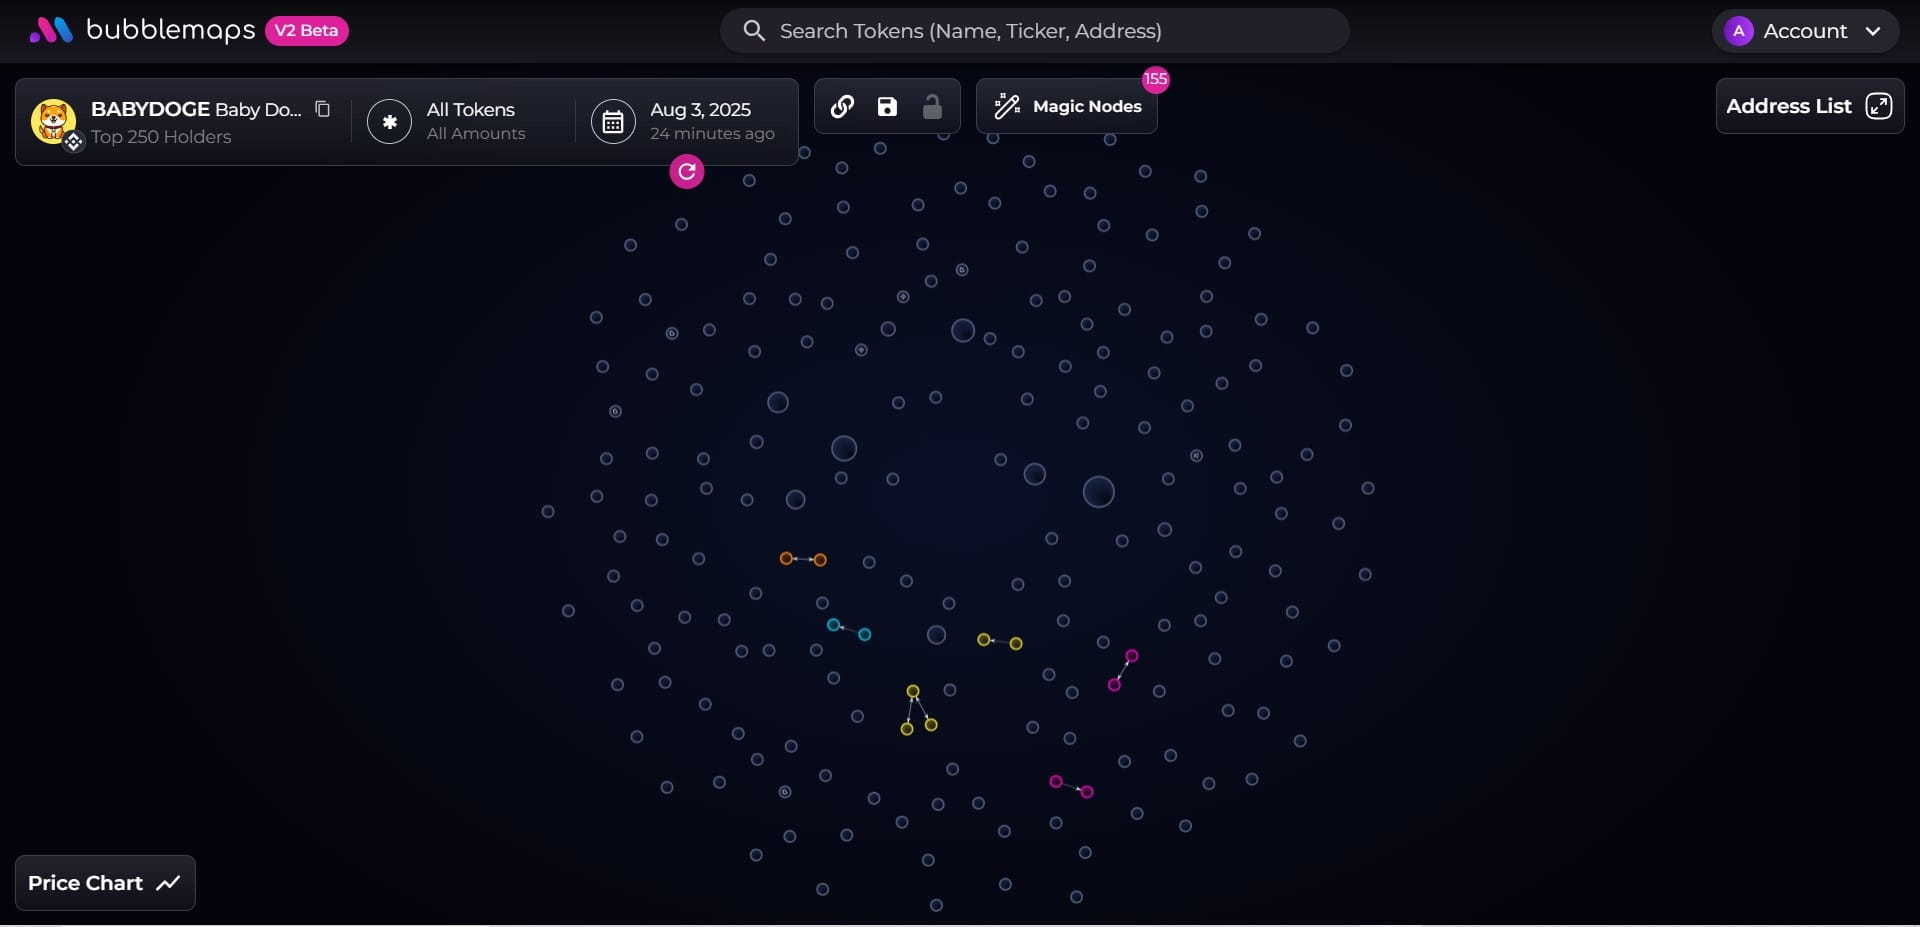
A simple way to get started with Bubblemaps is to check for anomalies in patterns. Your primary goal is to see if something is wrong; and there is an anomaly only when there is something normal. So an anomaly comes from comparing something with the normal. The normal is the standard, what we are accustomed to seeing in projects that have succeeded. In the context of a token, the norm would be a pattern that we are used to seeing in functional tokens of the same established category. A reference example for the normal distribution of memecoins would be Babydogecoin:
On the other hand, a distribution like the following should raise concerns:
Application on a recent rug pull: $Dege
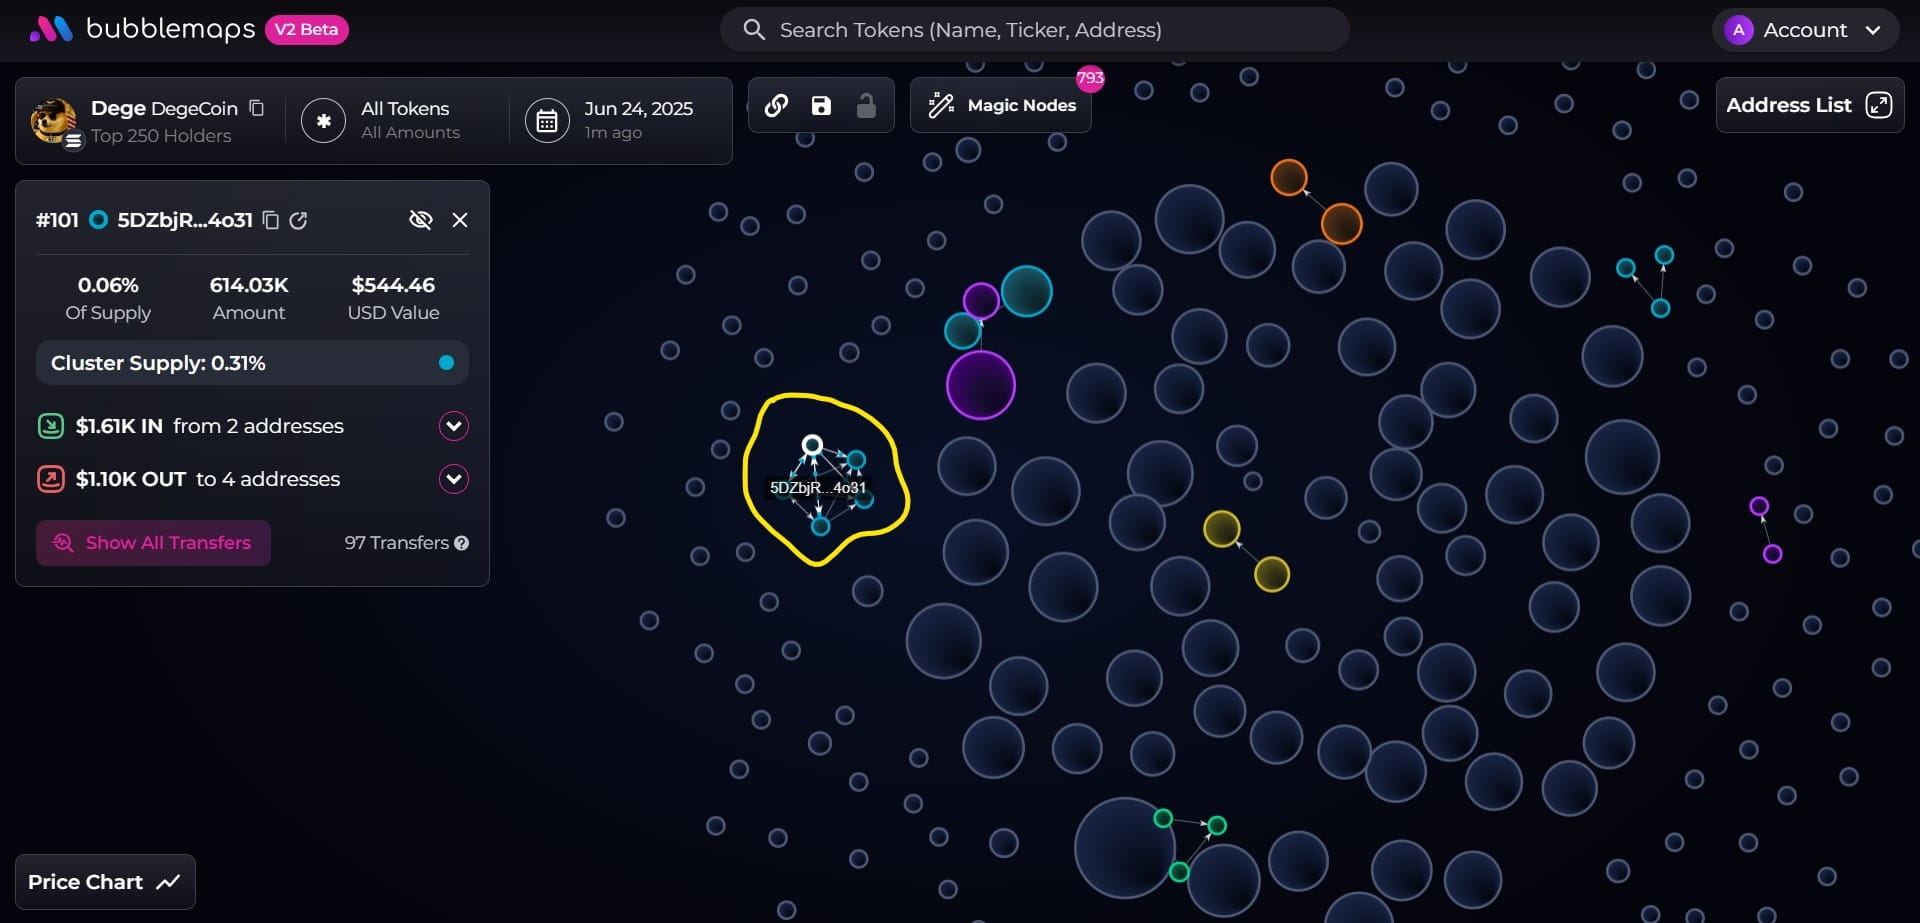
The bubble map below is that of $Dege at launch; it looks pretty cool, fairly well distributed except for a small cluster that controls only about 0.31% of the supply (total supply); which is not a big deal for a memecoin.
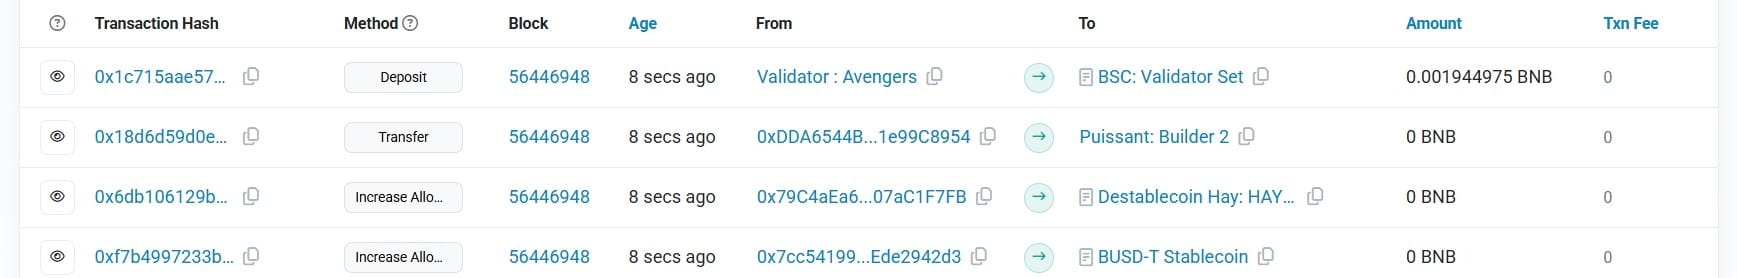
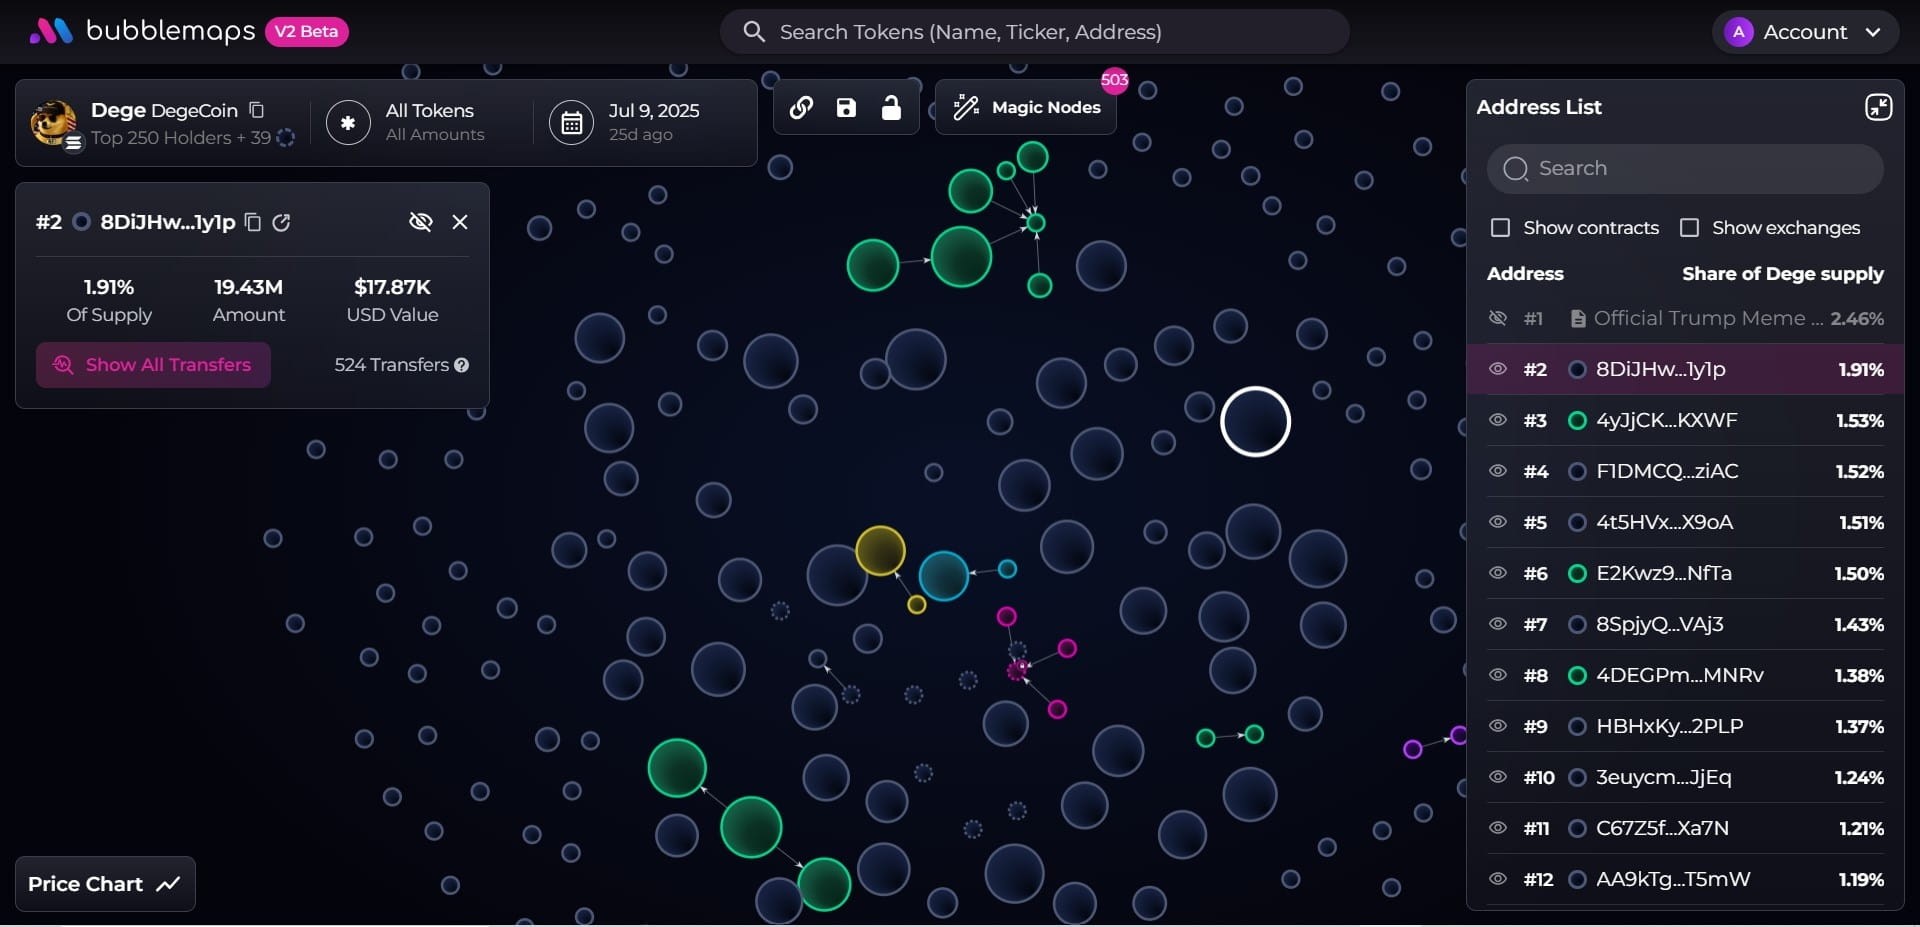
But then I wondered: what if it was done intentionally to conceal more obscure actions? So, I will dig a little deeper. To do this, I decided to look at the transactions of the largest holder, see with whom they are trading, one of them might teach us something. To see the list of top holders, simply click on 'Address list' located in the top right corner, and when you click on a wallet, a box opens on the left side of the screen with details about the wallet, including a button to access its transactions, that's what I did.
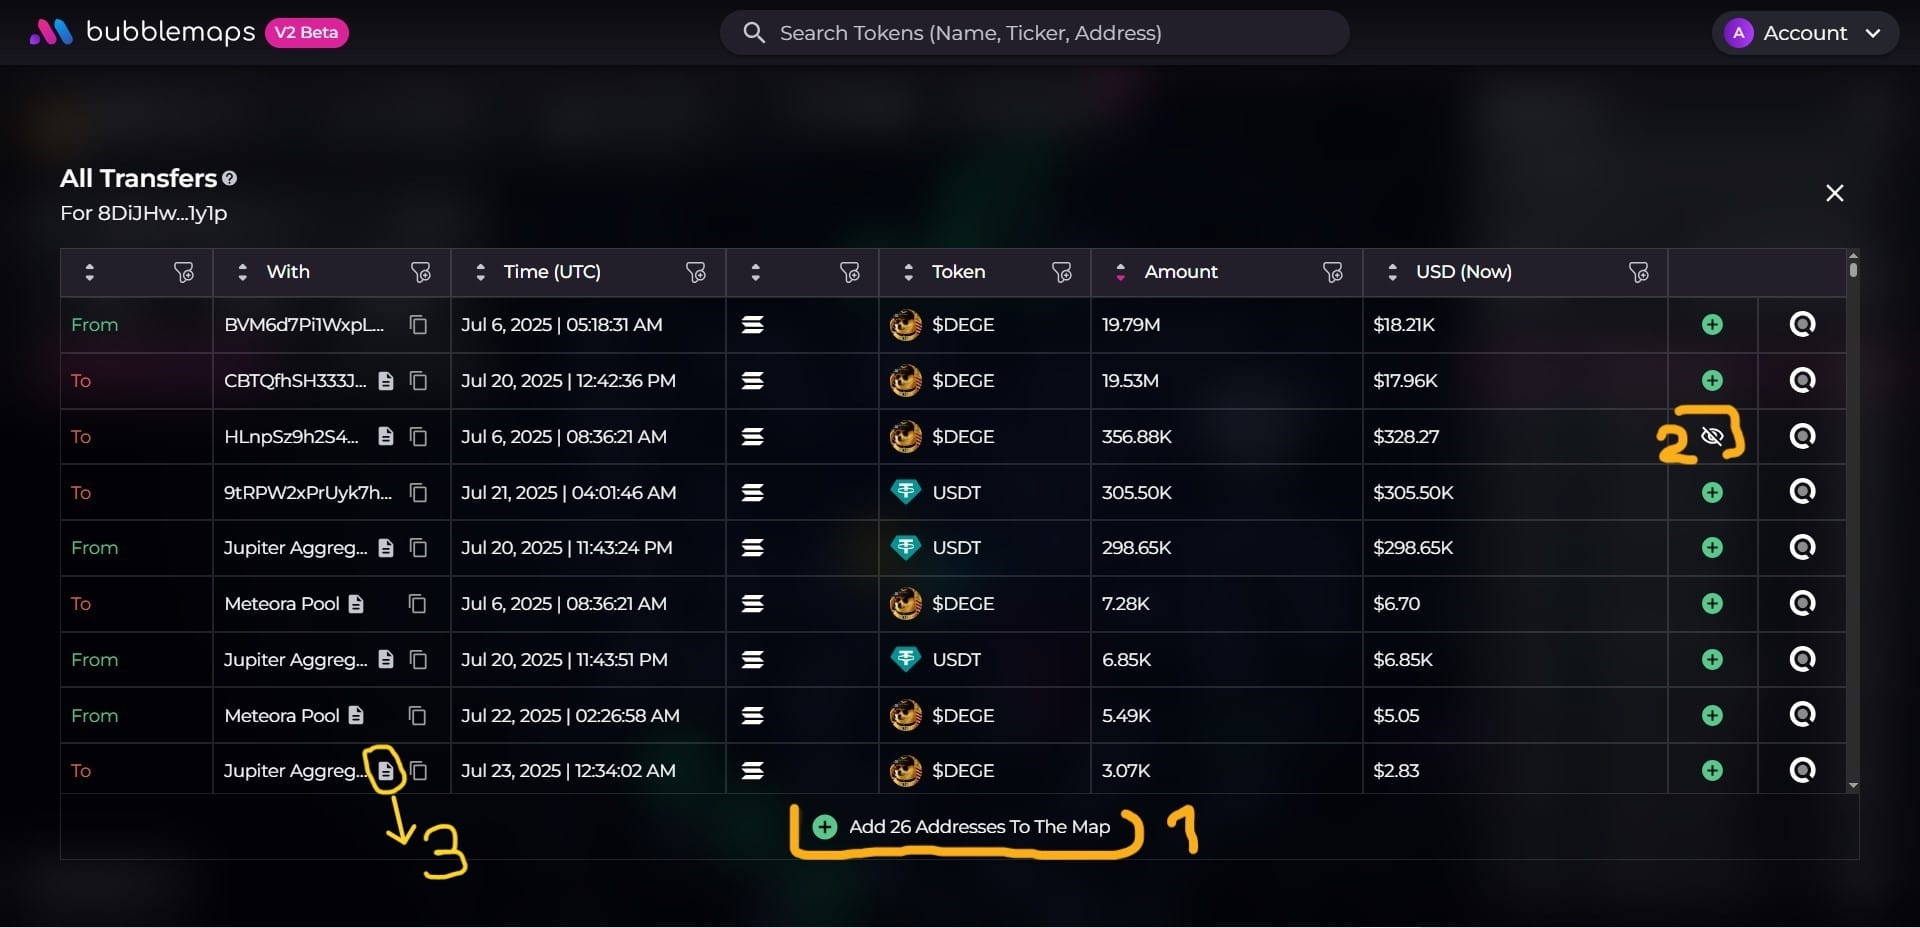
Once on the transaction history, I added all the wallets with which it had links (transfers) by clicking on button 1 of the capture above, then I tried to hide the addresses of the smart contracts and those with which it had dust transactions (less than $1 of SOL or the equivalent in $Dege at its beginnings) with icon 2. Smart contracts are the addresses with the document sign 📄 next to them (see icon 3).
After that, I hid the transaction history table by clicking on the cross (X) in the top left corner, to review the bubbles, and there, I discover something interesting:
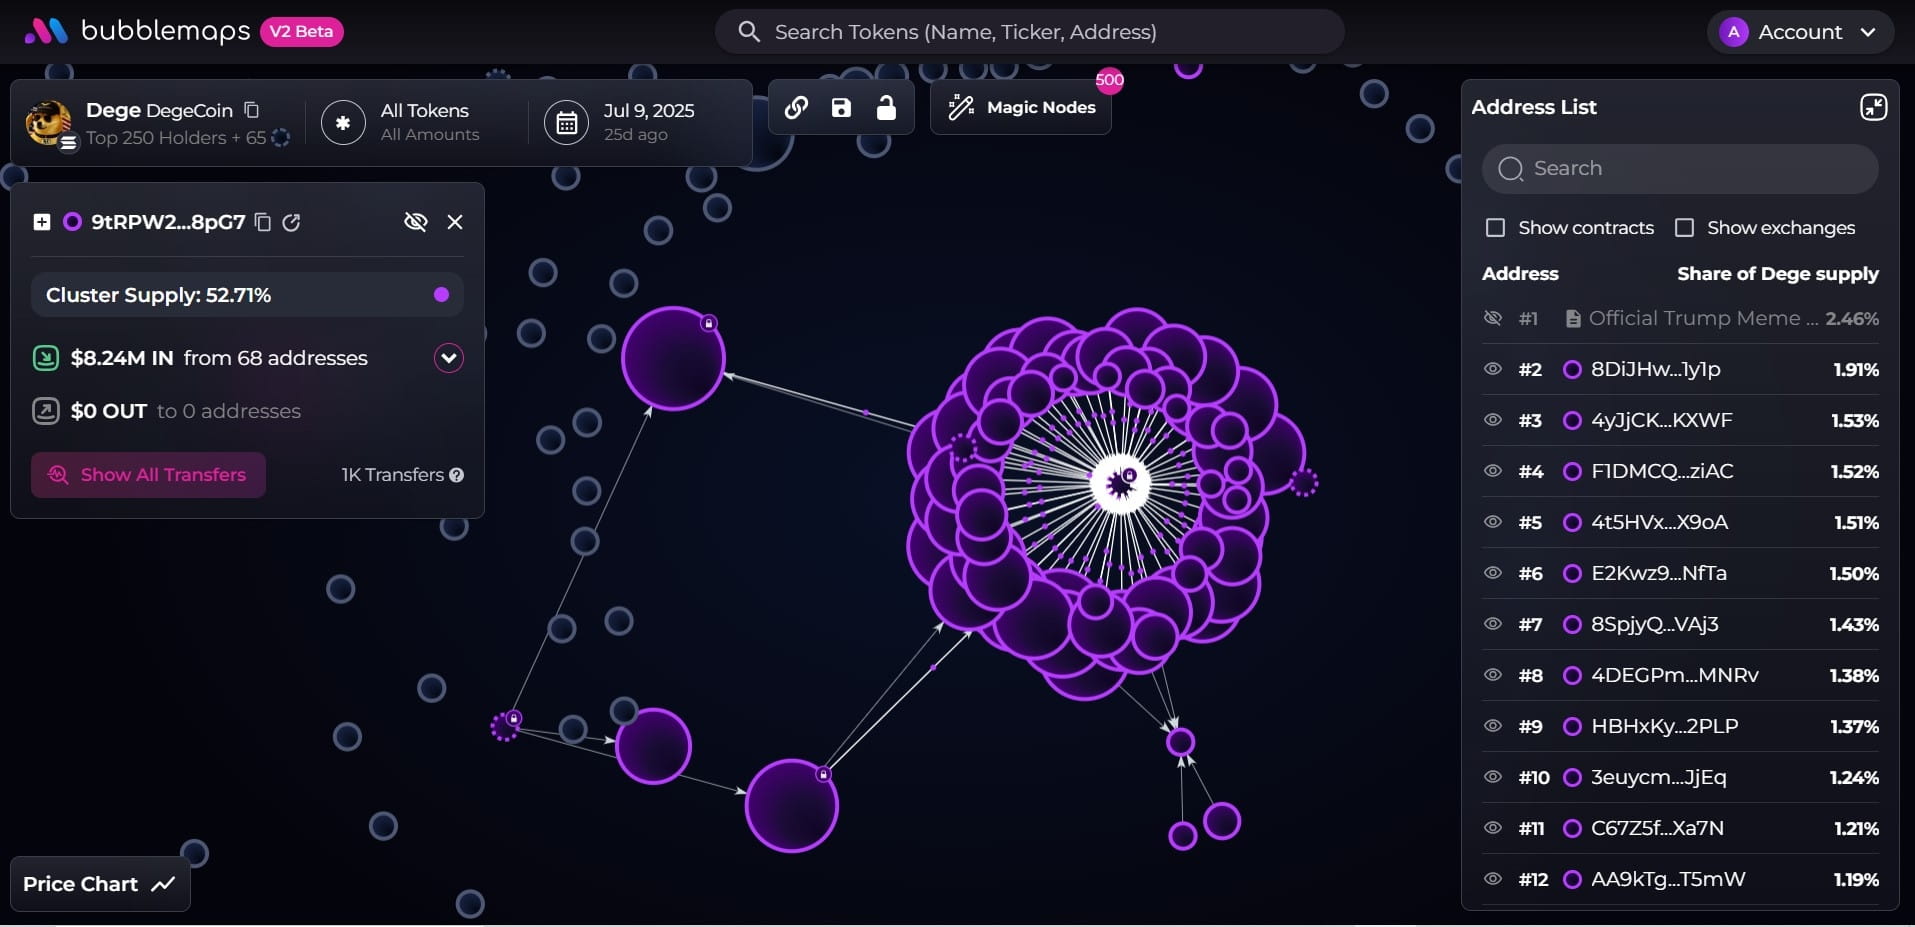
I see that there is an address linked to several top token holder addresses and with which it forms a cluster controlling more than 50% of the supply, which is a red flag for a memecoin, given that with such a quantity, they can sell their share at any time (cash out) and drain the liquidity, leaving individual investors with almost nothing. And that is exactly what happened. About a month after the launch, we see this:
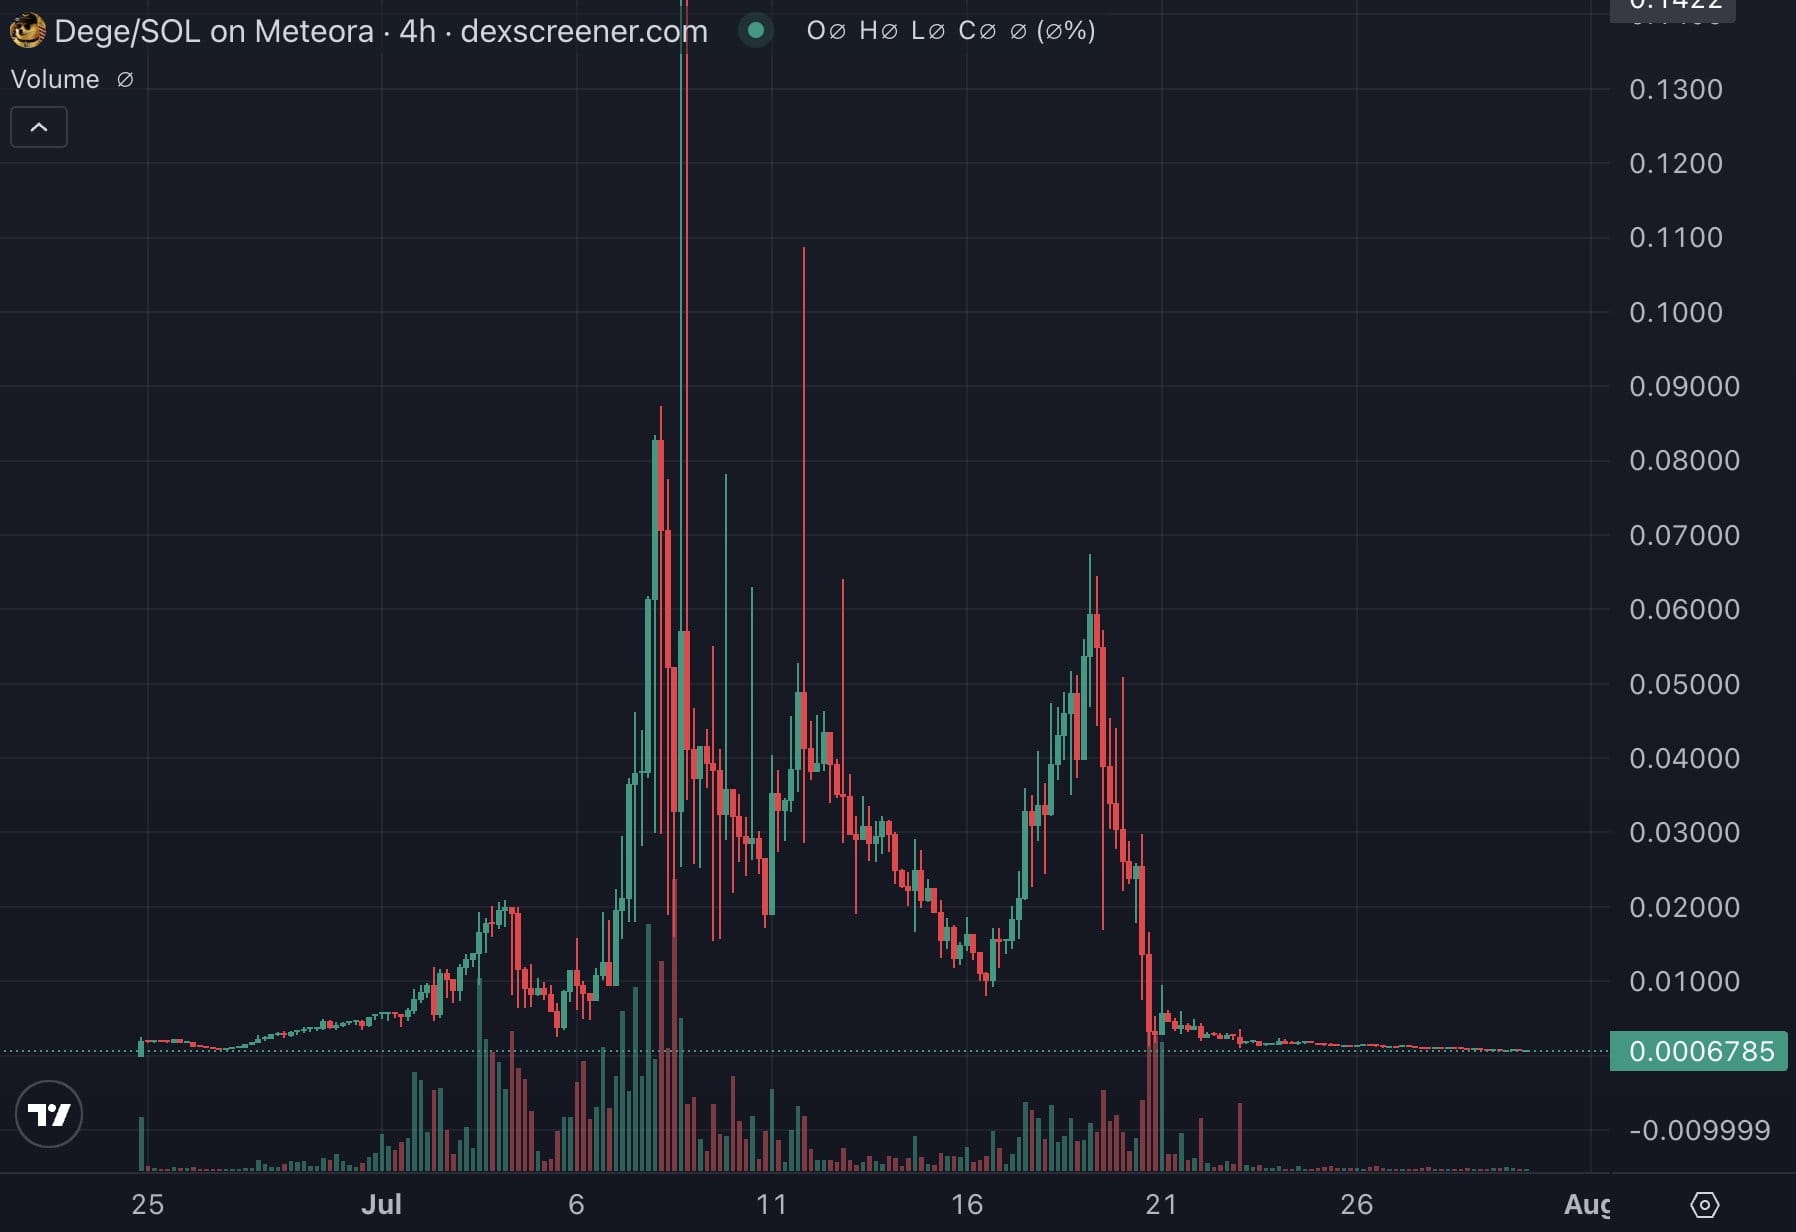 The money is gone.
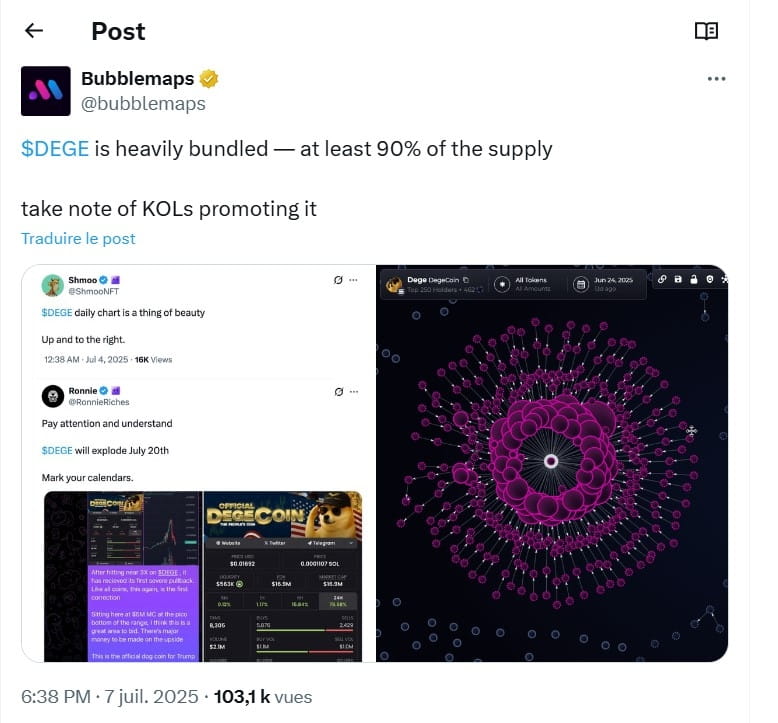
According to the work of the Bubblemaps team published on their X account on July 7, even before the insiders' cash out, the cluster in question controlled at least 90% of the supply.
This investigative procedure we just conducted can be done automatically thanks to a new feature of Bubblemaps called 'Magic Nodes', but it was important to understand the procedure for reflexes, in case some relationships are still hidden after activating the 'Magic Node'. The 'Magic Node' button is located at the top of your screen on Bubblemaps.
Conclusion
Clusters serve a narrative: we see a cluster, we ask questions, we search for answers together. If we find, that's great; if not, maybe we will have to dig deeper or ask the team. That’s also what sovereignty is about, individual responsibility, how much we can trust the founders of a project when so much money is at stake. As Nicolas Vaiman, co-founder of @Bubblemaps.io , stated, 'Crypto investigation is more of an art than a science'; thank you very much for your attention. Feel free to bubble and share your theories with me.


