According to a recent technical analysis by TradingView analyst Wesald, Bitcoin (BTC) could be on the verge of a massive price surge. The analysis suggests that a breakout is imminent, with a potential target of $167,000.
The Bullish Breakdown
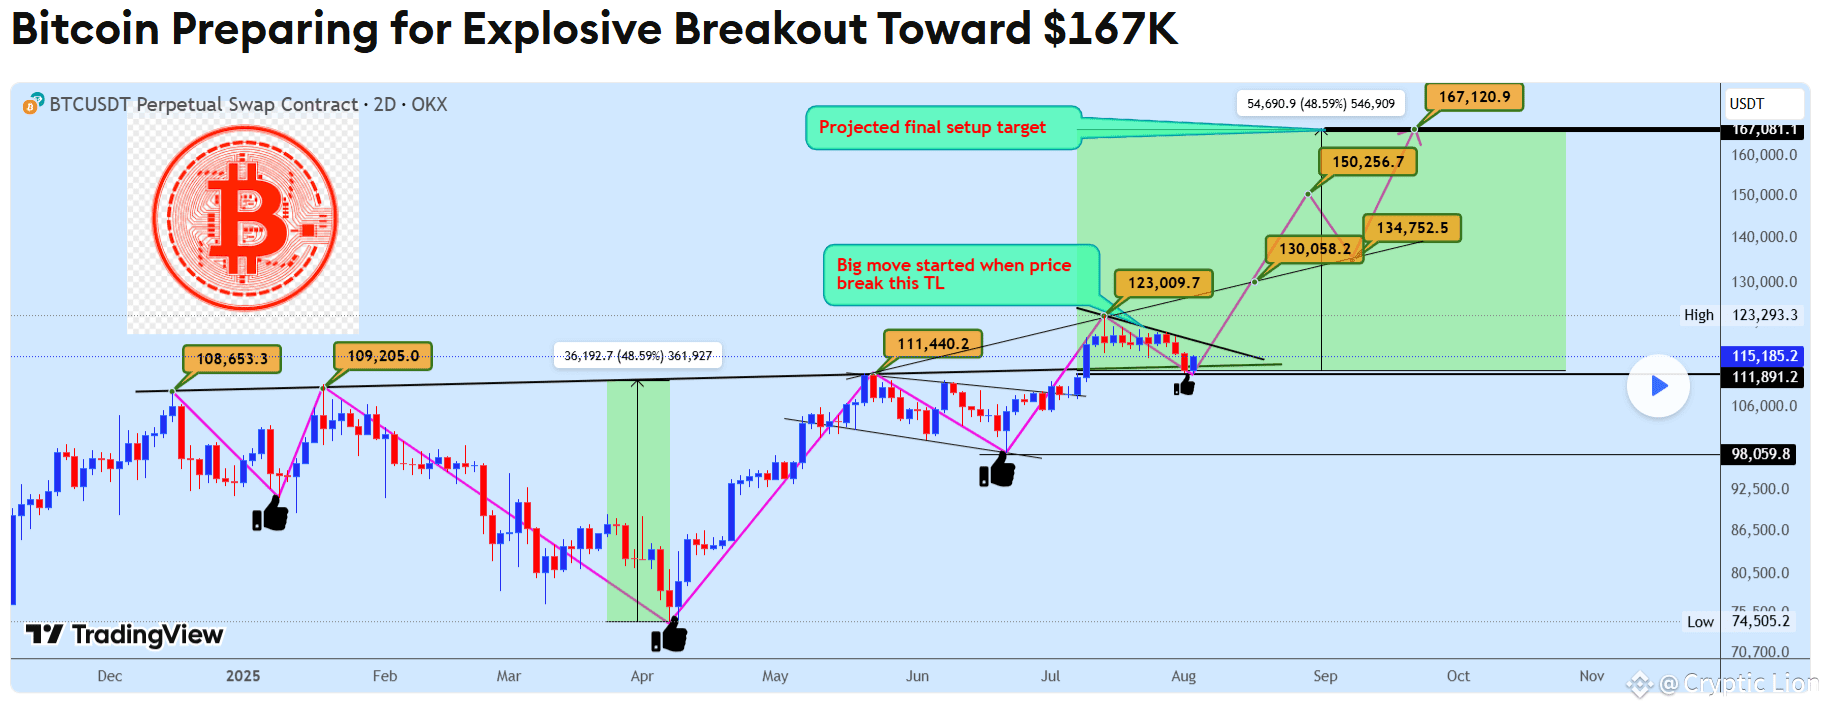
Wesald's analysis points to several strong technical signals:
Bullish Pennant: BTC is currently respecting a key trendline, which forms the upper boundary of a bullish pennant pattern.
Inverse Head and Shoulders: The price has held firmly above the neckline of a previously formed Inverse Head and Shoulders (ISHS) pattern, a historically bullish indicator. This confirms strong demand in the $111K–$113K region.
Measured Move: A projection based on a previous breakout suggests a potential 48% rally, similar to the one seen in April 2025. This move puts the $167,000 target in sight.
Key Price Levels to Watch
Support Zone: The $111,800 – $113,000 range is a crucial demand cluster.
Confirmation Level: A break and close above $123,000 would validate the breakout.
Primary Target: The $167,000 mark is the projected target.
Invalidation Zone: The bullish structure would be considered invalid if the price falls below $105,000.
What's Next?
Wesald advises traders to watch for a confirmed breakout from the pennant pattern. An ideal entry would be a buy order after the breakout is confirmed, potentially with a stop-loss order placed just below the $105,000 invalidation zone to manage risk.
You can find the full analysis and discussion on TradingView.
