

Bitcoin’s price stands at $114,930 on Tuesday morning, with a market capitalization of $2.28 trillion and a 24-hour trading volume of $34.71 billion. The past day has seen the cryptocurrency trade within a range of $113,941 to $115,591, as traders navigate a consolidation phase following July’s significant rally.

Bitcoin
On the daily chart, bitcoin remains in a corrective phase after a strong July rally from roughly $105,130 to $123,236, representing a 17% gain. Price action shows sideways movement with a slight downward bias following profit-taking at the peak. Current support is established at $112,000, with stronger support at $108,000, while resistance remains firm in the $116,500 to $118,000 range. Until price decisively breaks above $118,000 on strong volume, the short-term bias leans neutral to bearish. The market is searching for a decisive catalyst to set its next direction.
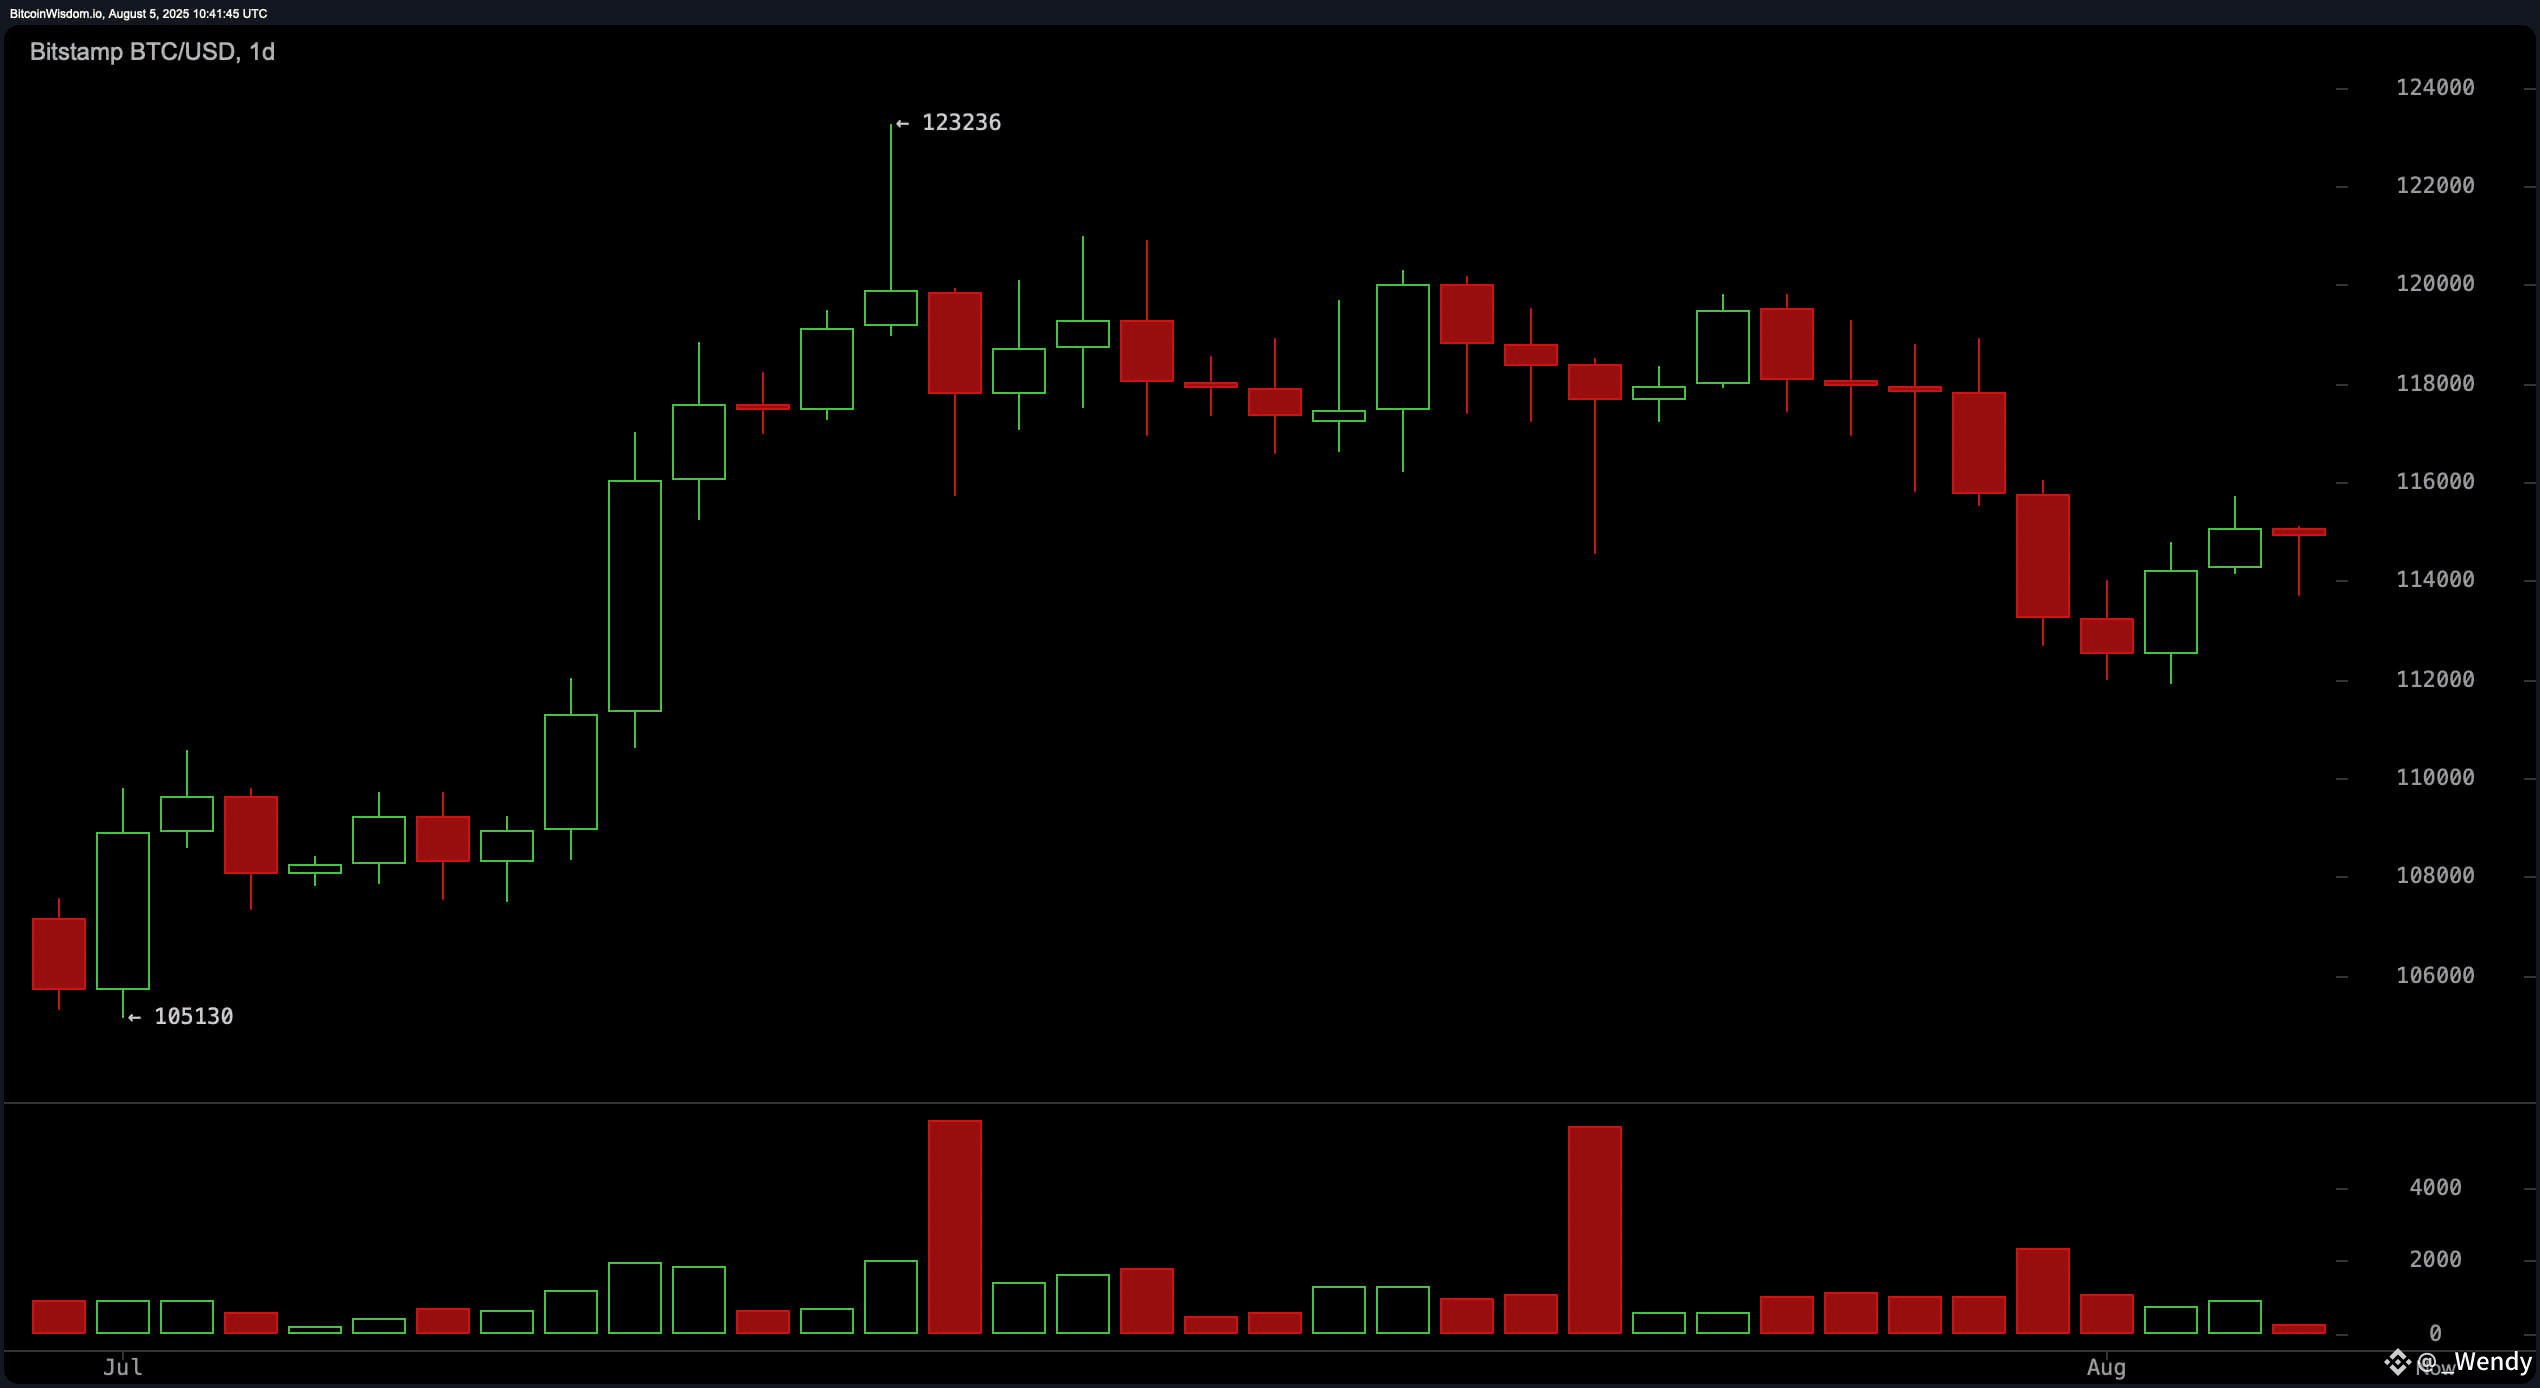
BTC/USD 1-day chart via Bitstamp on Aug. 5, 2025.
The four-hour bitcoin chart reflects a rejection from $118,904, followed by a sharp decline to $111,919. The recovery since has been low in volume and less convincing, with repeated resistance near $115,000. Support is seen at $113,000, and a potential bear flag pattern is forming, suggesting a risk of further downside if support fails. A break below $113,000 could open the door to retests of $111,900, while a breakout above $115,200 with strong volume could target $116,500–$117,000.
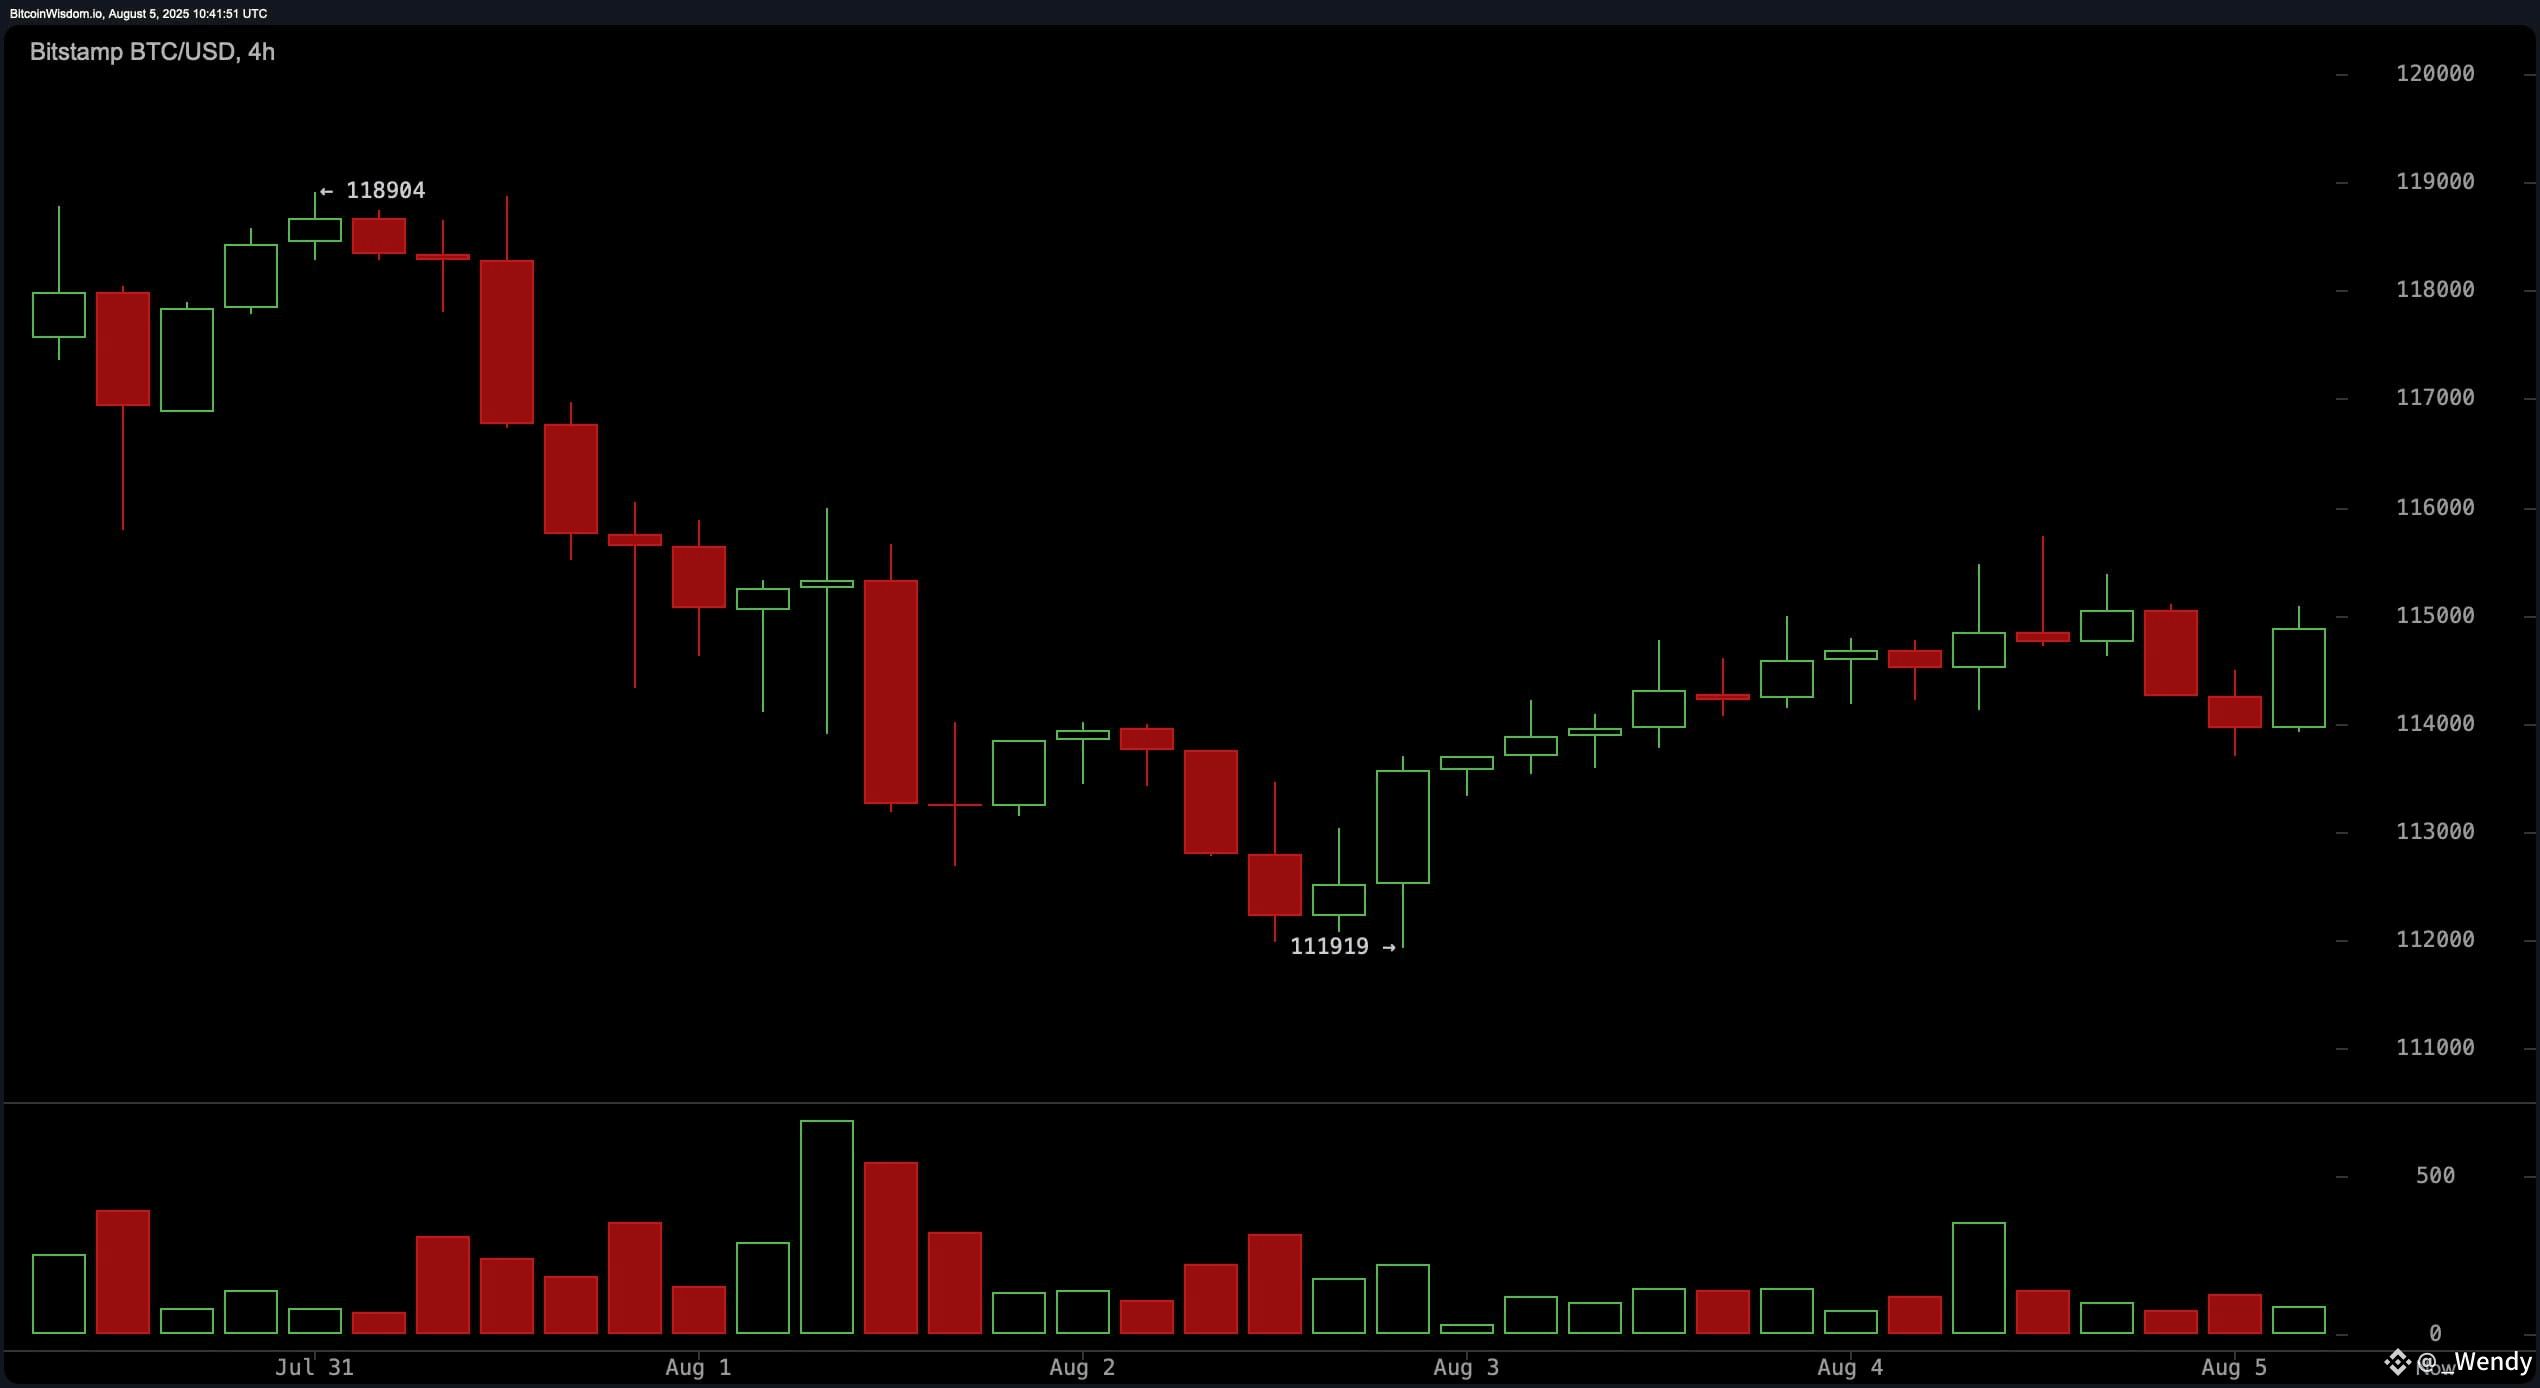
BTC/USD 4-hour chart via Bitstamp on Aug. 5, 2025.
On the one-hour bitcoin chart, intraday resistance at $115,700 has capped multiple rally attempts, while support at $114,000–$114,300 has been tested several times. Volume analysis shows selling pressure outweighing buying interest, suggesting bulls may struggle to maintain momentum without fresh buying support. If the $114,000 support fails, intraday traders may look for downside targets near $113,000. Conversely, a confirmed breakout above $115,700 could open short-term upside potential toward $116,500.
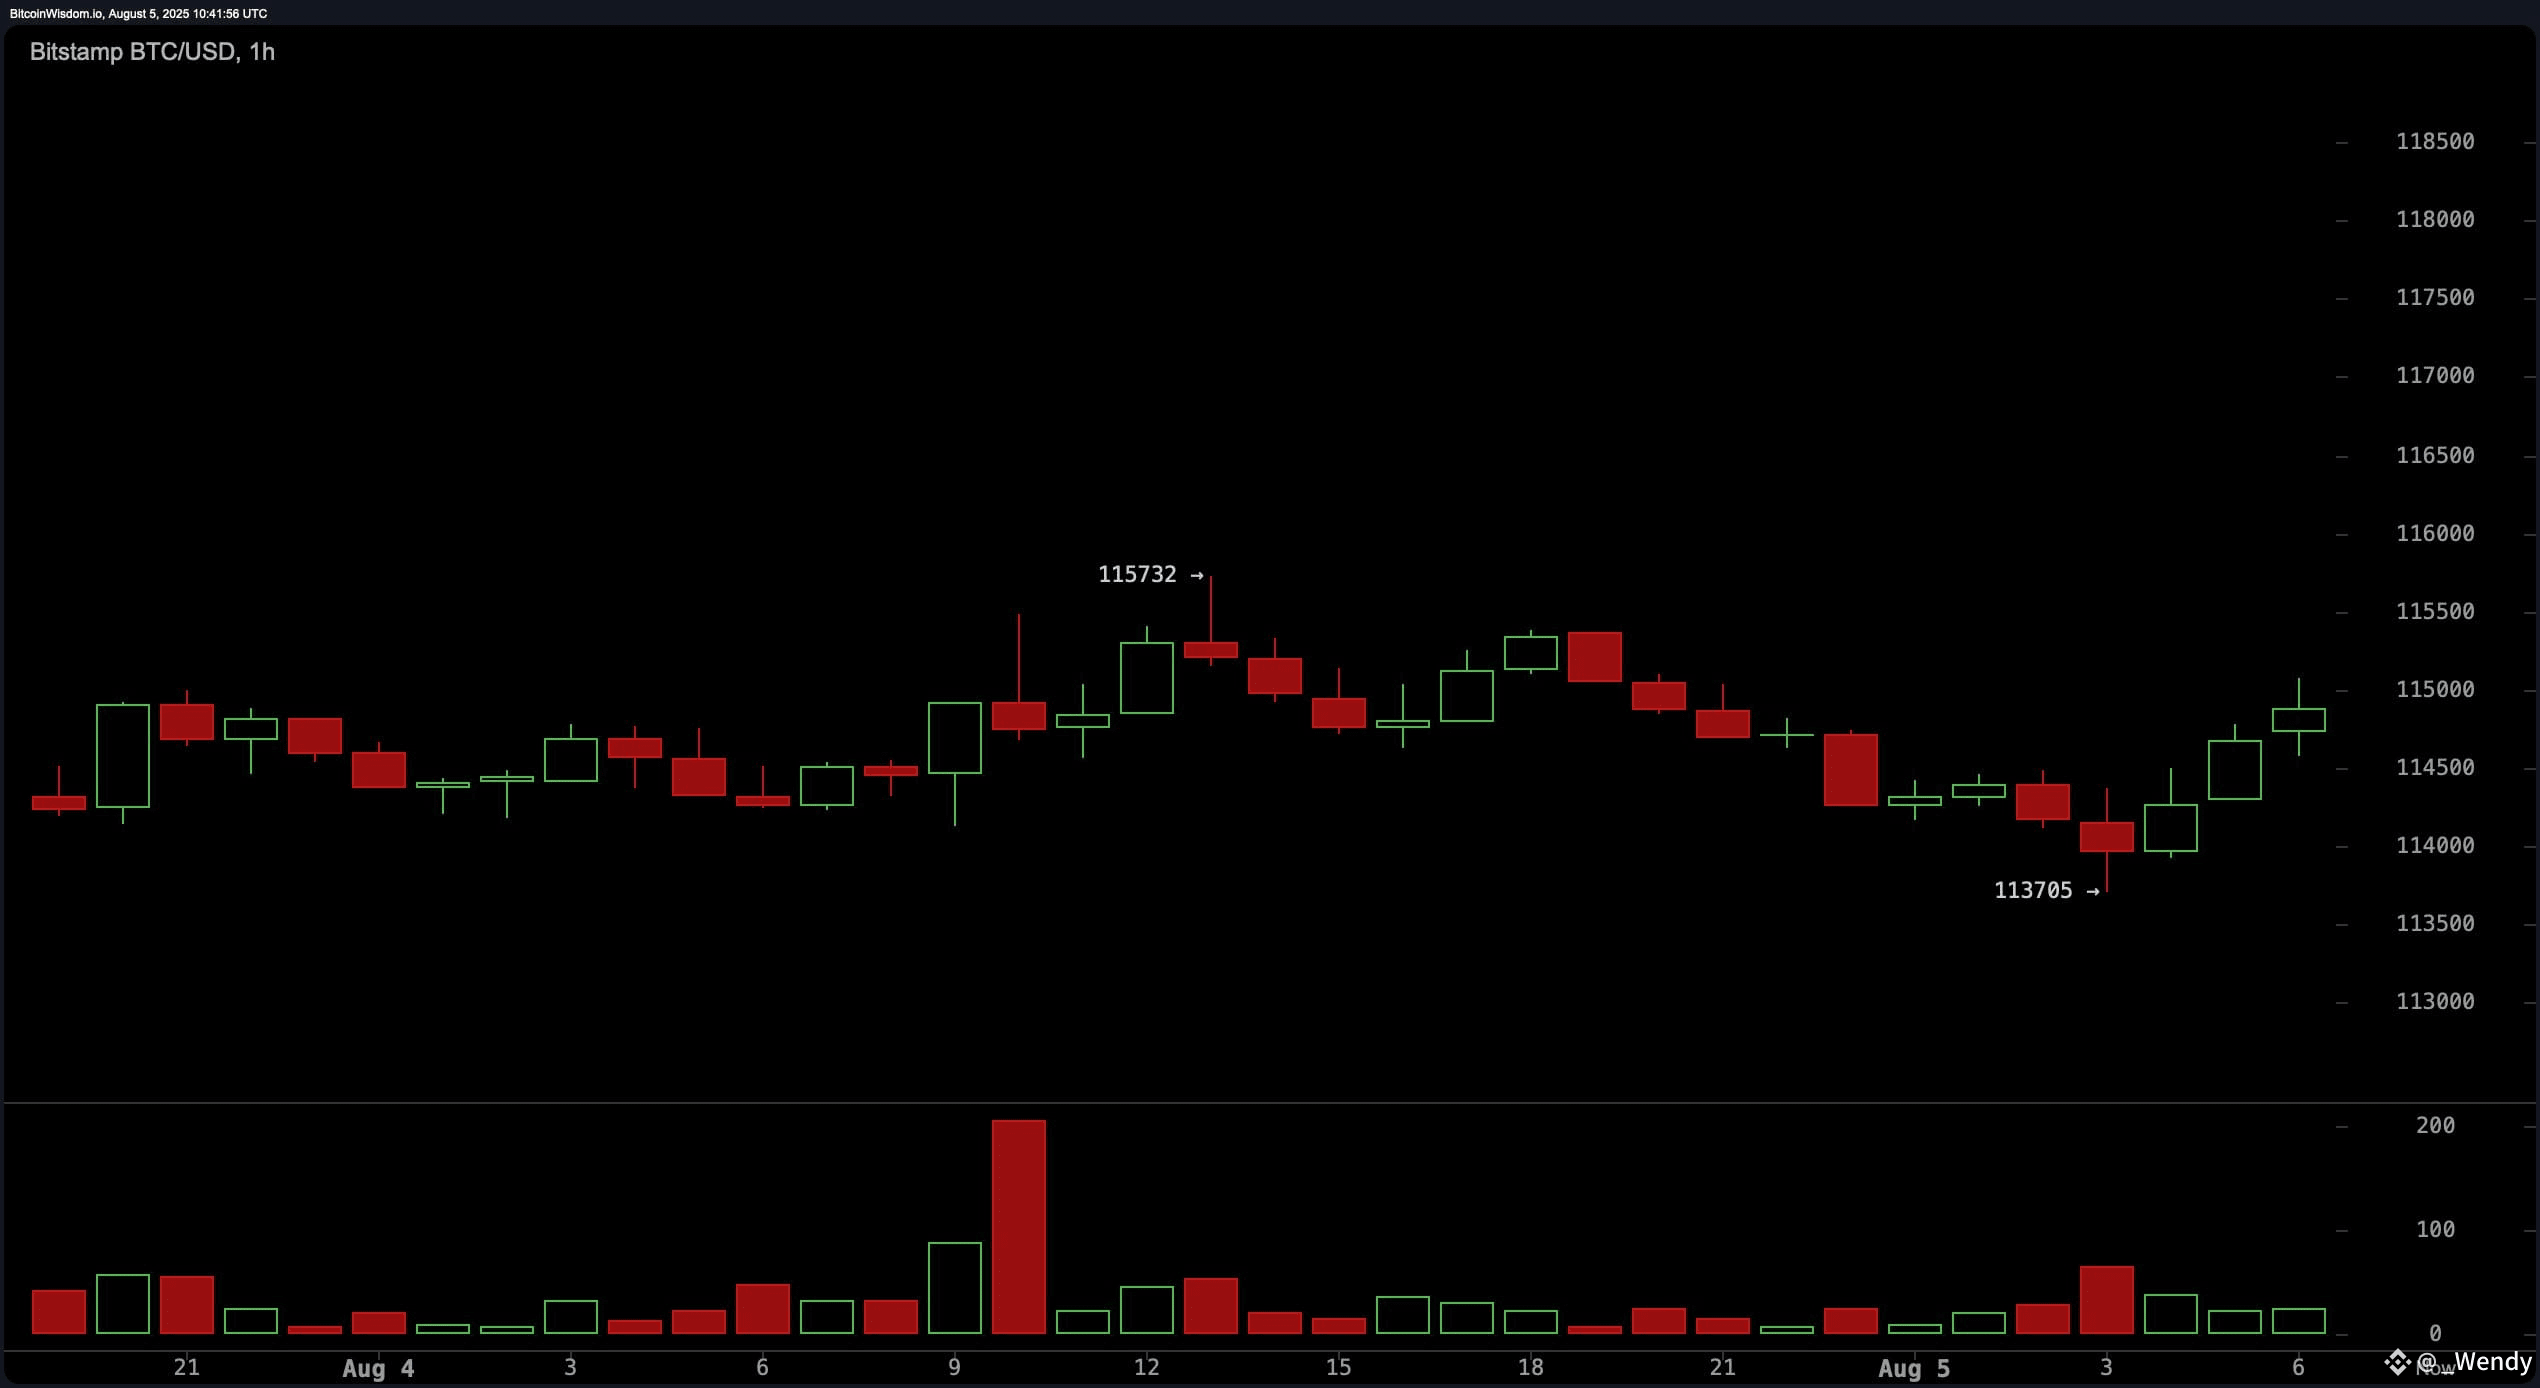
BTC/USD 1-hour chart via Bitstamp on Aug. 5, 2025.
Oscillators present a mixed outlook. The relative strength index (RSI) stands at 49, indicating neutral momentum, while the Stochastic oscillator is also neutral at 34. The commodity channel index (CCI) at −105 signals positivity, suggesting potential recovery, but momentum at −3,022 and the moving average convergence divergence (MACD) level at 239 both issue bearish signals. The average directional index (ADX) at 19 confirms the lack of a strong trend, and the Awesome oscillator at −1,526 remains neutral. This blend of indicators points to market indecision.
Moving averages display a split picture between short- and long-term sentiment. The exponential moving average (EMA) for 10, 20, and 30 periods, along with their simple moving average (SMA) counterparts, are all above the current price and signaling bearish conditions. However, the EMA and SMA for 50, 100, and 200 periods are below the current price, each issuing bullish signals, reflecting broader uptrend resilience. The alignment suggests that while short-term pressures remain bearish, the longer-term outlook still favors the bulls if key support levels hold.
Bull Verdict:
If bitcoin can decisively break above $115,700 on strong volume, short-term momentum could shift in favor of buyers. A sustained move through $116,500 would increase the likelihood of testing the $118,000 resistance zone, potentially reigniting the broader uptrend fueled by the longer-term moving average buy signals.
Bear Verdict:
Failure to hold support at $114,000 per bitcoin would likely invite further selling pressure, with immediate downside targets at $113,000 and $111,900. The prevailing short-term bearish signals from oscillators and short-term moving averages suggest that a breakdown could trigger deeper retracements toward the $108,000 support zone.
