🧠 Introduction to Bubblemaps: Making Blockchain Data Visual and Actionable
In an industry where transparency and decentralization are paramount, @Bubblemaps.io offers a revolutionary way to visualize wallet distribution and on-chain behavior. Unlike traditional blockchain explorers that offer tabular or textual insights, Bubblemaps introduces an interactive, bubble-based interface that reveals the interconnectedness between wallets, their token holdings, and suspicious clustering that could indicate insider activity or potential rug pulls.
With the growing frequency of scams and untrustworthy projects—especially during meme token seasons—tools like Bubblemaps are not just beneficial; they’re essential.
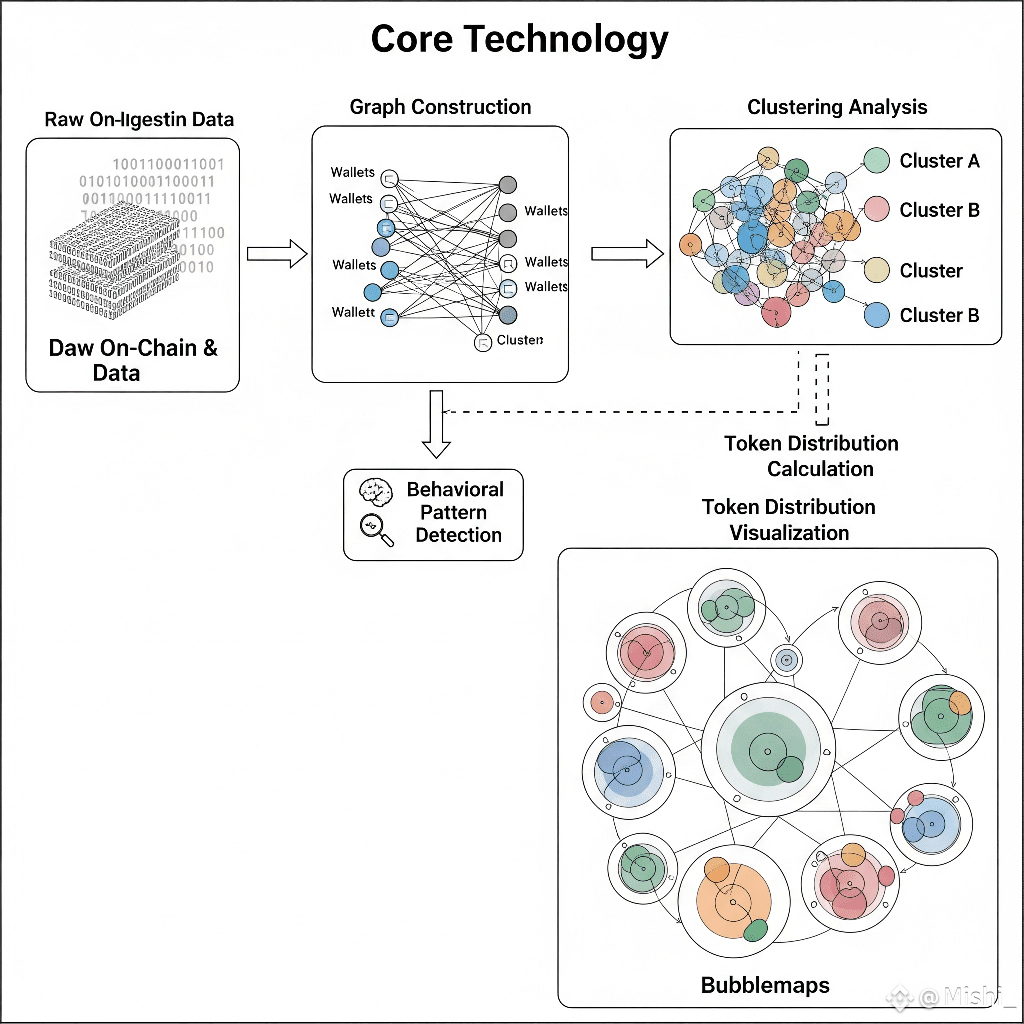
🔎 Core Technology Behind Bubblemaps
Bubblemaps leverages a combination of data clustering algorithms, on-chain analytics, and graph theory to build real-time, interactive visuals. Here's a technical breakdown:
Graph Construction: Bubblemaps builds a directed graph, where nodes represent wallets, and edges represent transactions or behavioral correlations.
Clustering Analysis: By applying hierarchical clustering and density-based spatial clustering (DBSCAN), wallets that show correlated behavior (same inflows/outflows, timings, or token patterns) are grouped.
Token Distribution Visualization: Wallets are sized based on token holdings and colored according to association groups. This helps immediately identify large holders and suspicious connections.
Time-Series Overlay: Analysts can observe how wallet distributions change over time, critical for post-launch token behavior tracking.
The result? A visually intuitive interface that gives immediate insight into whether a token is decentralized or secretly concentrated.
🚨 Use Case: Detecting Rug Pulls in Meme Tokens
During meme coin booms, it's common for developers or insiders to pre-mint large amounts of tokens and distribute them across interconnected wallets to simulate a fair launch. With Bubblemaps, you can instantly spot:
Wallet clusters with shared origins
Sudden wallet inactivity followed by synchronized sell-offs
Abnormally high wallet concentrations
This gives traders and investors the ability to exit early or avoid altogether high-risk tokens.
🧰 The Intel Desk – Decentralized Due Diligence
One of the most innovative features of Bubblemaps is the Intel Desk, which turns due diligence into a community-powered operation.
Community members can submit findings, flag suspicious clusters, and comment on projects.
Each verified contribution earns rewards in $BMT.
This builds a crowdsourced intelligence layer on top of the raw data.
This feature essentially transforms Bubblemaps into a decentralized Chainalysis-lite—but open and incentive-driven.
🏗️ Infrastructure and Ecosystem: Why $BMT Is Critical
The $BMT token is the utility and reward token of the Bubblemaps ecosystem. Here's how it powers the system:
Access to Premium Insights: Stake or spend $BMT to access in-depth wallet behavior metrics and historical data.
Governance Rights: Token holders can vote on features, investigations, and data prioritization.
Intel Desk Rewards: Contributions to investigations are rewarded in $BMT, ensuring fair compensation for community researchers.
Ecosystem Expansion: $BMT helps fund integration with new blockchains and Layer-2 solutions.
As the platform expands, $BMT will become increasingly valuable—positioning it as a cornerstone of transparent DeFi operations.
🌐 Why Bubblemaps Is Becoming an Industry Standard
From institutional analysts to everyday traders, the need for clean, readable, and actionable on-chain data has never been greater. Bubblemaps meets this need by offering:
Real-time updates with lightning-fast indexing
Multi-chain support, including Ethereum, BNB Chain, Avalanche, and more
Seamless integration with existing DeFi dashboards
It's not just a visual tool—it's a risk management platform, a research layer, and a community-driven watchdog.
📊 Real-Time Benefits for Traders and Analysts
Instantly assess token decentralization at launch
Spot token distribution red flags during presale or post-launch
Gain an edge in identifying pump and dump schemes
Use wallet data correlations to predict price movement or large sell-offs
In an age where meme coins can launch and crash within hours, speed and clarity in data analysis can mean the difference between gains and losses. Bubblemaps delivers that edge.
📣 Final Thoughts
@Bubblemaps.io is changing the way we understand blockchain data. It’s not just about who holds tokens—it’s about how those holders are connected, and what that means for price action, community trust, and project legitimacy.
The addition of the Intel Desk, coupled with the utility of $BMT, creates a powerful ecosystem for community-driven transparency. Whether you're a DeFi degenerate, institutional analyst, or first-time investor, Bubblemaps gives you the tools to see the invisible—before it's too late.
👉 Join the revolution with @Bubblemaps.io , explore #Bubblemaps , and dive into the power of $BMT
Tag: @Bubblemaps.io | Hashtag: #Bubblemaps | Token: $BMT