
After falling below a key support level, Bitcoin is trying to recover some of the downward momentum. According to analysts, the performance of the largest cryptocurrency in the world this week will play a decisive role in the next trend.
Bitcoin Loses the 'Bull Flag' Pattern on the Weekly Chart
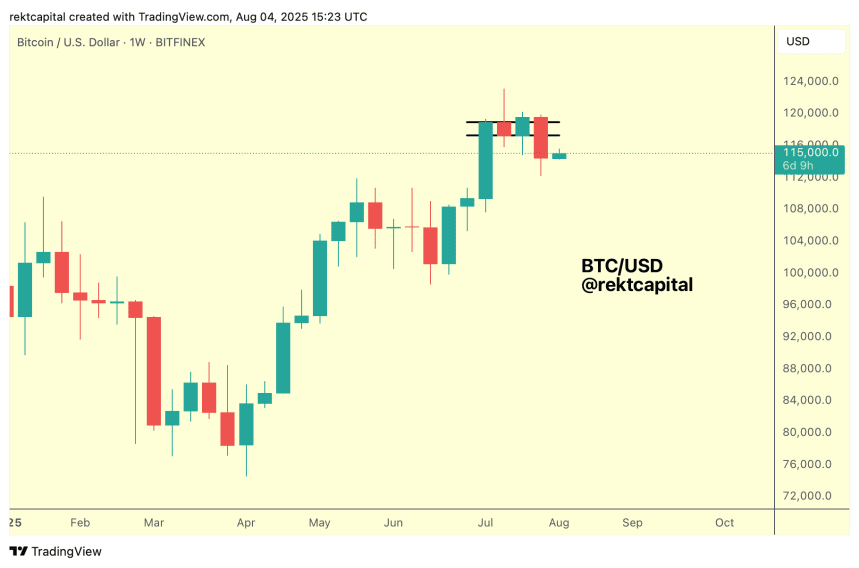
Last weekend, Bitcoin lost the post-breakout accumulation range for the first time in three weeks, hitting a local bottom at 112,296 USD on August 3.
Previously, since the beginning of July, BTC has fluctuated in the range of 114,000 – 120,000 USD after successfully breaking out, even reaching a new historical peak at 122,838 USD.
As July comes to an end, the market experiences strong volatility, with BTC testing the bottom of the trading range twice. However, unlike the previous time, Bitcoin could not bounce back this time and officially lost a crucial support area on August 1.
Analyst Rekt Capital points out that BTC had previously formed a Bull Flag pattern on the weekly chart, with the bottom of the pattern serving as support until the last weekly candle close. Losing this level is a concerning signal for the bullish trend.
This Week – A Survival Test
According to Rekt Capital, BTC's performance this week will determine whether the bottom of the Bull Flag around 117,200 USD will become new resistance or if BTC can reclaim that price range and restore its bullish structure.
If support is reclaimed: the current decline will be considered a 'false breakdown' and BTC may return to an upward trajectory.
If support turns into resistance: this will be a bearish retest, confirming the break and potentially pushing BTC back to test the 112,000 USD mark.
The Second Price Discovery Trend Risks Ending Early
Currently, the Price Discovery Uptrend 2 (the second attempt at finding a new peak price) of BTC has entered its fifth week. Historically, this phase often starts to slow down in weeks 5-6, with peaks occurring in an area known as the 'Danger Zone.'
If BTC reclaims the Bull Flag and tests new peaks, this trend will continue as per historical trajectory.
Conversely, if it closes the weekly candle below the support area and confirms the break, the second Price Discovery trend may have ended just after the second week – much faster than history.
This means BTC will enter Price Discovery Correction 2 (correction after the second peak attempt), completely contradicting historical trends.
Long-Term Outlook Remains Open
Nevertheless, Rekt Capital assesses that in the long run, BTC still has enough time to form Price Discovery Uptrend 3 (the third attempt at finding a peak).
If the second trend ends early, then the third trend could fully compensate for the shortcomings of the previous trend.
The duration of the correction also plays an important role:
If there is a short correction, BTC could still make another strong surge before the bear market begins.
If there is a correctionthat lasts, the new upward momentum will be delayed and may struggle to achieve the expected performance.
📌 In summary: This week is extremely important for Bitcoin. Whether BTC can reclaim the 117,200 USD area or turn it into resistance will be the key factor determining the trend in the short and medium term.
