🌐 Total Market Capitalization Analysis: Long-Term Upward Trend and Trading Scenarios
I think you guys need to read this article!!
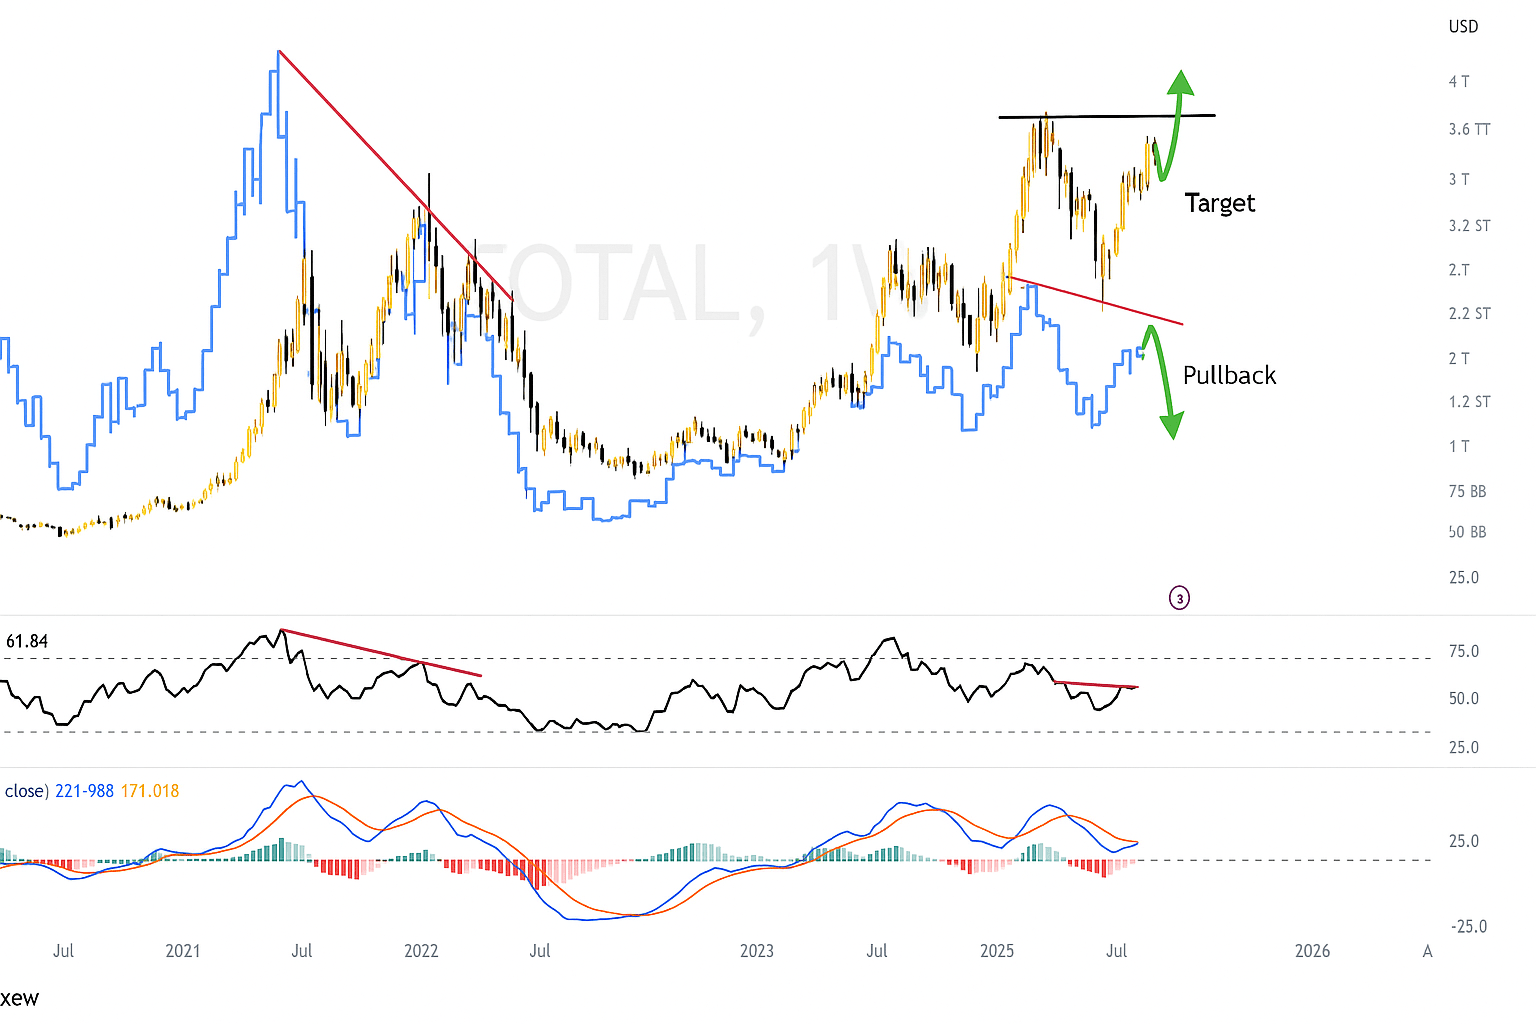
The crypto market is witnessing a strong recovery from the 2022 lows, with total capitalization breaking up to 3.67 trillion USD. This is an important signal indicating that the medium – long-term upward trend is still maintained. However, some technical indicators suggest that the market may experience a short-term correction before continuing to break out.
1️⃣ Market Context
In recent weeks, large capital flows have continued to return to the crypto market. Total capitalization has broken the resistance of 3.5T USD, turning this area into an important support. If it maintains above this level, the market is likely to aim for higher milestones, with 4.0T USD being the next resistance.
2️⃣ Technical Analysis
📈 Price and Behavior Breakout
Confirmed breakout: Breaking above 3.5T USD with stable volume indicates a reinforced upward trend.
Major support: 3.5T USD – this area could be an important buying point if prices adjust.
Next resistance: 4.0T USD – area to test buying strength.
📊 MVRV Z-Score
Currently at 2.22, still below the 'overheated' zone (>3.5), indicating the market has room to grow.
However, the long-term downward trend of MVRV needs to be monitored as it may signal that buying pressure has not truly exploded.
🔎 RSI (Relative Strength Index)
RSI is at 61.84, within the high neutral zone.
Bearish divergence appears when prices rise but RSI falls → warning of potential short-term technical correction.
📉 MACD (Moving Average Convergence Divergence)
MACD is still positive and above the signal line, confirming the upward trend.
However, MACD has also shown a bearish divergence, in phase with RSI → the market may need a 'cooling off' period before continuing to rise.
3️⃣ Expected Scenarios
🟢 Growth Scenario (Bullish)
Price holds above 3.5T USD and continues to break through 3.85T USD and further to 4.0T USD.
Confirmation conditions: MVRV exceeds 3, RSI returns to the 70 zone along with increased trading volume.
🔴 Pullback Scenario
Price may adjust to the 3.2T – 3.3T USD range to test demand strength.
This will be a healthy retest before the market continues its new upward cycle.
4️⃣ Trading Strategy
Short Term Investors
Entry:
Buy around the 3.50T – 3.55T USD range if there’s a retest.
Or wait for a breakout above 3.75T USD with high volume.
Target:
Target 1: 3.85T USD
Target 2: 4.0T USD
Stop-loss: Below 3.40T USD to limit risk.
Medium – Long Term Investors
Entry:
Accumulate around the 3.40T – 3.50T USD support range.
Buy more if it exceeds 4.0T USD with volume confirmation.
Target:
Target 1: 4.5T USD
Target 2: 5.0T USD
Stop-loss: Below 3.25T USD if the market breaks the upward structure.
5️⃣ Risks to Keep in Mind
Bearish divergence on RSI and MACD may cause the market to adjust in the short term.
Macroeconomic fluctuations from interest rates and global monetary policies.
Events related to ETFs and the regulatory frameworks of major countries.
✅ Conclusion
The long-term bullish trend remains dominant. If the market adjusts to the 3.5T USD area, this will be a golden opportunity for accumulation for both short-term and long-term investors. Risk management through stop-loss and monitoring MVRV Z-Score will be key factors to optimize profits and preserve capital.