🔍 In-Depth Technical Analysis (1D Timeframe)
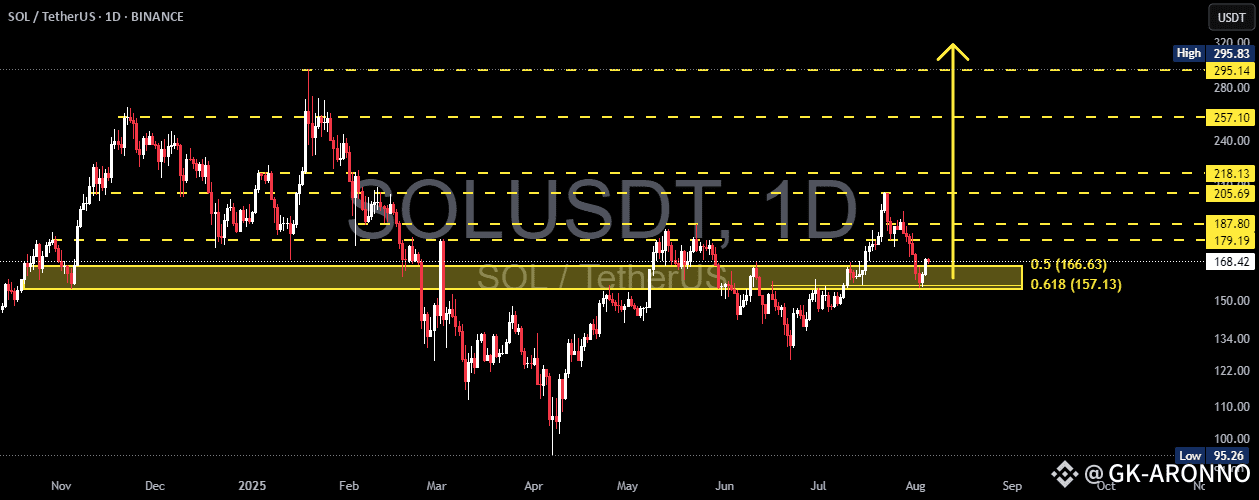
The SOL/USDT pair is currently showing a highly significant technical reaction as price bounces from the Fibonacci Retracement 0.5 - 0.618 zone (also known as the Golden Pocket), located between $166.63 - $157.13.
This level also aligns perfectly with a historical demand zone that has previously acted as a strong support during high-volume selloffs, creating a powerful confluence area.
---
🧩 Market Structure & Pattern
✅ Golden Pocket + Demand Zone: This overlap strengthens the probability of a valid bullish reversal.
🟠 Previous Movement: Price dropped from the recent swing high near $188 after failing to break through major resistance.
📉 Short-Term Downtrend: Currently in a corrective phase after an earlier bullish run.
---
🟢 Bullish Scenario (Rebound Confirmed from Golden Pocket)
If the price manages to hold above the $157 - $166 range and prints a bullish candle with volume confirmation:
1. A bullish breakout above $179 and more importantly $187.80 could open the door to further upside.
2. Potential midterm bullish targets:
🎯 Target 1: $205.69 (key psychological + structural level)
🎯 Target 2: $218.13 (previous reaction zone)
🎯 Target 3: $257.10
🎯 Target 4 (macro): $295.14
> The current zone offers an attractive risk-to-reward opportunity for swing traders, as long as the higher low structure is maintained.
---
🔴 Bearish Scenario (Breakdown from Key Support Zone)
Should the price break below $157 with strong selling volume:
1. That would invalidate the bullish setup and suggest a shift in structure.
2. Potential deeper correction targets include:
⚠️ Support 1: $140 (minor support from past structure)
⚠️ Support 2: $122 - $110 (major support zone from March–April 2025)
> A confirmed breakdown here would likely initiate a lower high – lower low structure, signaling a possible shift into a bearish medium-term trend.
---
📌 Additional Key Indicators to Watch
🔄 Volume Spike: Essential for validating any breakout or breakdown.
📉 Daily RSI: If RSI shows bullish divergence or bounces from oversold territory, that would strengthen the bullish case.
⏳ Daily Candle Close: Monitor the next 2–3 daily candle closes around this key zone for directional confirmation.
---
💡 Conclusion
SOL is at a crucial inflection point. The reaction around the $157 - $166 support confluence will likely determine the medium-term trend:
Bullish: If price reclaims $179–$188 zone with strong momentum
Bearish: If price breaks below $157 and closes with volume
This could be a high-reward opportunity for technical traders if confirmed properly.
---
🧠 Suggested Strategy:
🔹 Entry: Upon bullish confirmation in current demand zone
🔹 Stop Loss: Below $155 (for swing setups)
🔹 Take Profit Zones: $179 → $205 → $218 → $257+
