

@Caldera Official #Caldera $ERA
📊 Analysis of the asset ERA/USDT (4H, Binance)
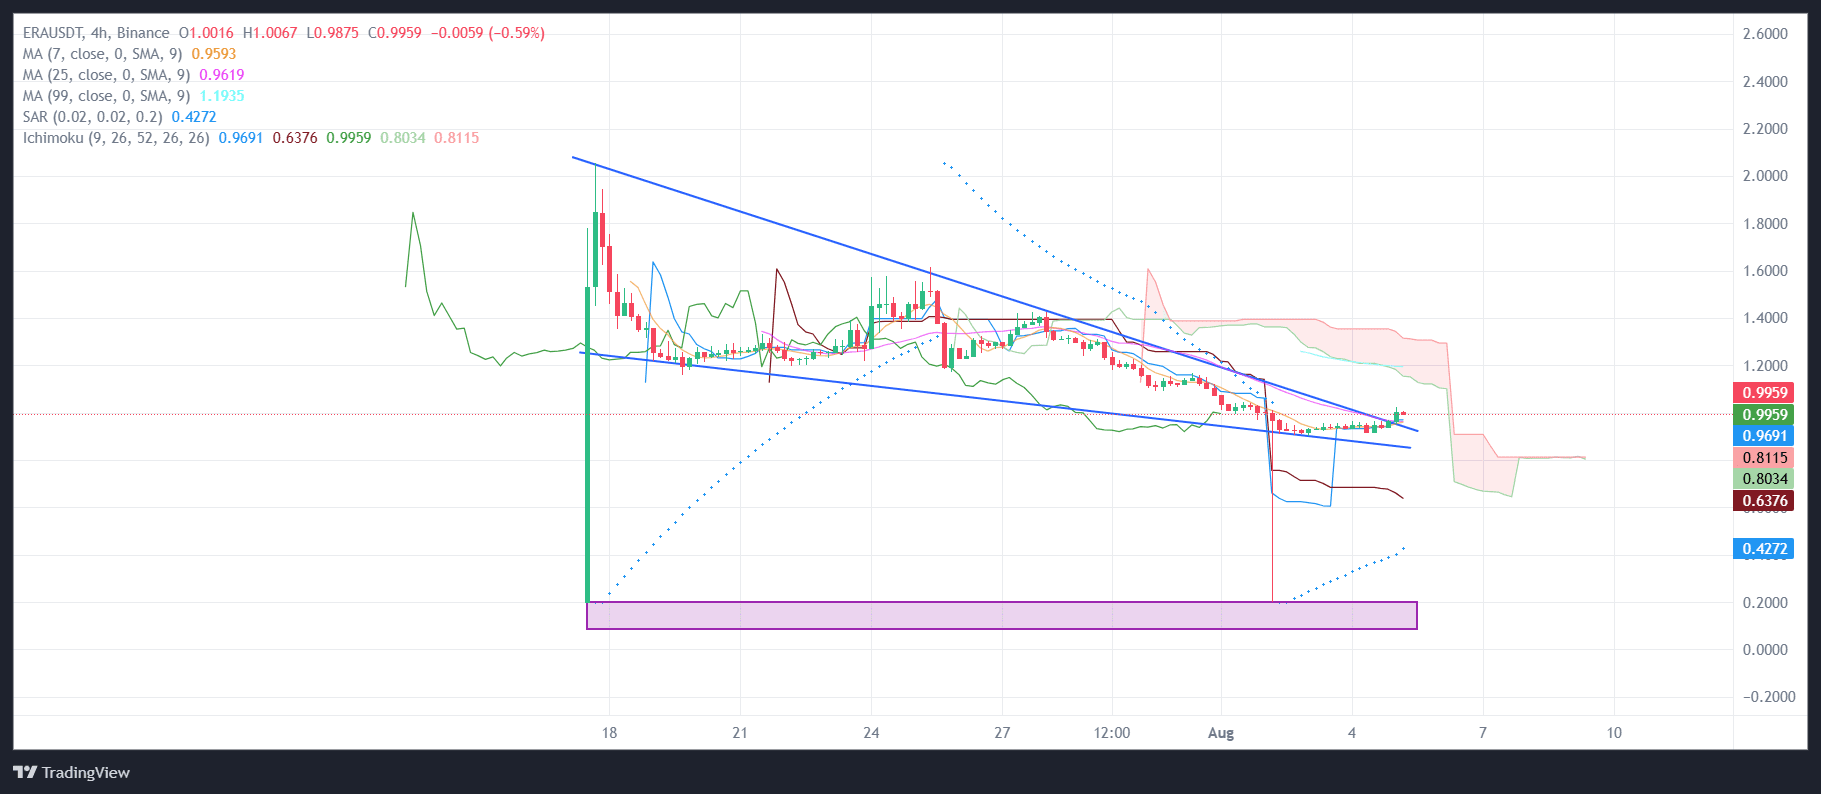
🧩 Figure, impulse, key levels, and market reaction
📉 Figure: Descending wedge
The chart clearly shows a descending wedge — a classic bullish pattern. The price has been consistently narrowing within the wedge and has finally broken out upwards past the upper boundary of the structure.
Such a breakout, especially against the backdrop of a downtrend and low volatility, indicates a possible reversal and the beginning of an upward movement. 📈
⚠️ Anomaly: Spike to the support zone $0.20–$0.25
In the middle of the wedge, a sharp "spike" downwards is observed — a fast and deep wick reaching the purple zone of key support. This may be:
Liquidation/stop hunting before the reversal
Market makers' reaction to weak liquidity
Potentially — a false breakout downwards to collect liquidity
⚠️ Important: the price has immediately returned to the structure, which strengthens the reliability of the support zone.
🔍 Indicators and technical picture:
The price is above the Ichimoku cloud, confirming a shift in the short-term trend to bullish.
Breakout of MA(7) and MA(25) from below upwards — an additional signal for long
SAR has moved below the price — support of the rising impulse
MA(99) remains above — the long-term trend is still bearish, but a breakout of MA(99) may confirm a phase shift.
📌 Key levels:
🟣 Support zone: $0.20–$0.25 (marked by a spike — capitulation zone)
🔼 Current resistance zone: $1.00–$1.05
🚀 Targets upon consolidation: $1.15 / $1.25 / $1.40
🧠 Conclusion:
ERA has exited the descending wedge with strong technical confirmation. The spike down to key support can be viewed as capitulation and final liquidity collection. It is now important to watch for consolidation above $1.00 — this will confirm the beginning of an upward structure. 💥
📌 Support holds, the structure is bullish, interest in the asset is recovering.
🔔 We are monitoring volumes and dynamics in the next 1–2 days.

