
Ethereum is trying to recover after dropping below $3,500. With support holding firm and RSI bouncing back, will the price break through to the next $3,838 or is a deeper pullback ahead?
Ethereum Price Prediction: Bullish recovery or short-term trap?
Ethereum (ETH) is trading at $3,550, recovering from a recent decline and testing support just above $3,500. After a multi-week bullish run and peaking just below the $3,838 resistance level, the chart shows ETH is consolidating—but is it ready for the next bullish move, or will we see more declines?
ETH is holding above an important support level
After reaching a local peak near $3,838, Ethereum corrected and found support around the $3,530–$3,550 zone. This area has become a crucial short-term demand level. The recovery here is encouraging, especially as the daily candle forms a higher low compared to the July low.
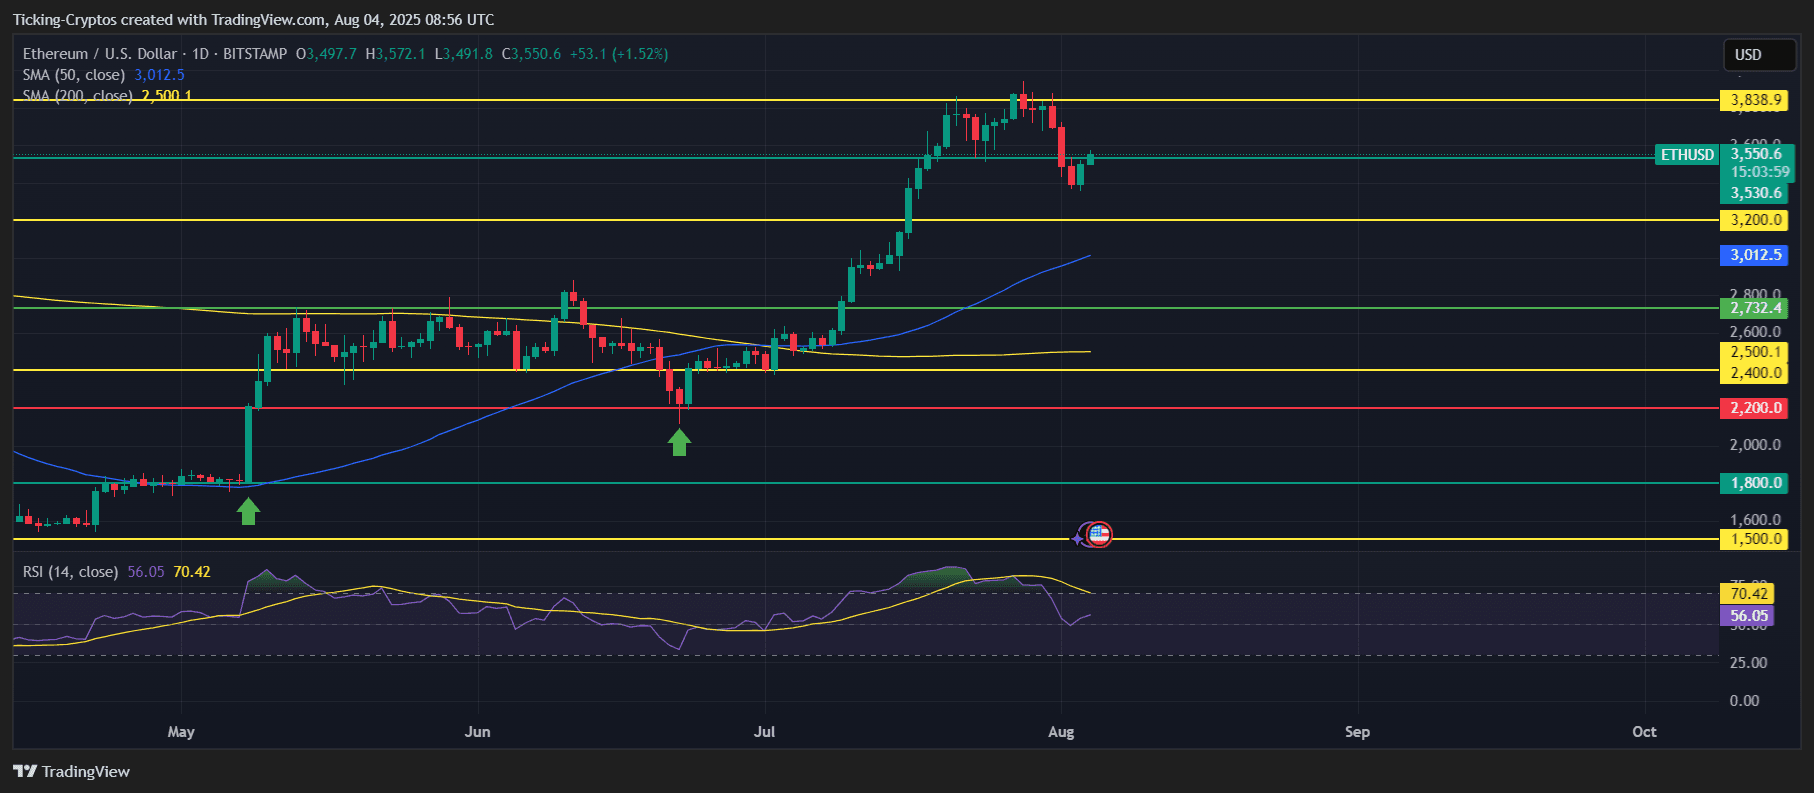
The 50-day SMA is currently at $3,012, acting as a dynamic support level during the bullish rally in June-July. As long as ETH maintains above this level, the bullish structure remains intact.
Key levels to watch
From the chart:
Resistance level:
🔼 $3,838 (Recent high)
🔼 $3,620 (Small horizontal resistance level)
Support:
🔽 $3,530 (Current support level)
🔽 $3,200 (Important horizontal support level)
🔽 $3,012 (50-day SMA)
🔽 $2,732 (Strong demand zone)
Losing the $3,530 mark could lead to a retest of the $3,200 level. Below that, $3,012 will become a decisive level for the bulls.
RSI indicates the potential for momentum re-establishment
The 14-day RSI indicator has recently cooled off from the overbought zone, currently around 56.05. This suggests there is still room for higher gains before ETH becomes overheated again.
It is important that the RSI has bounced back after safely testing the 50 level—traditionally, this is a good sign that the bullish trend continues in trending phases.
ETH vs Bitcoin: A correlation to watch
While Ethereum is holding its support level, it is worth noting that Bitcoin is still consolidating around the support level from $112,000 to $115,000. If BTC drops below, ETH may also decline—even if its own chart looks optimistic.
The macro environment is also a factor: with the cryptocurrency market generally slightly down this week, caution is needed before assuming an immediate breakout.
Ethereum Price Prediction: Next is $3,200 or $3,838?
With the current chart structure and momentum:
If ETH holds above $3,530 and trends upward, the next target remains $3,838, with a potential breakout pushing ETH above $4,000 in a new phase.
If ETH loses $3,530, the price could drop to $3,200 and potentially down to the SMA 3,012 support zone.
Trend: Neutral - bullish when price is above $3,530. The bullish trend is only confirmed if ETH closes a daily candle above $3,620.