Trading cryptocurrencies means repeating simple tasks consistently; sticking to one method for a long time can lead to mastery. Trading can be just like any other industry, where practice makes perfect, allowing you to make every decision effortlessly.
This year marks my seventeenth year trading cryptocurrencies. I entered the market with 10,000, and now I support my family through trading! I can say that I've tried 80% of the methods and techniques in the market. If you want to treat trading as a second profession to support your family, sometimes listening and observing more can uncover things beyond your current understanding, potentially saving you five years of detours!
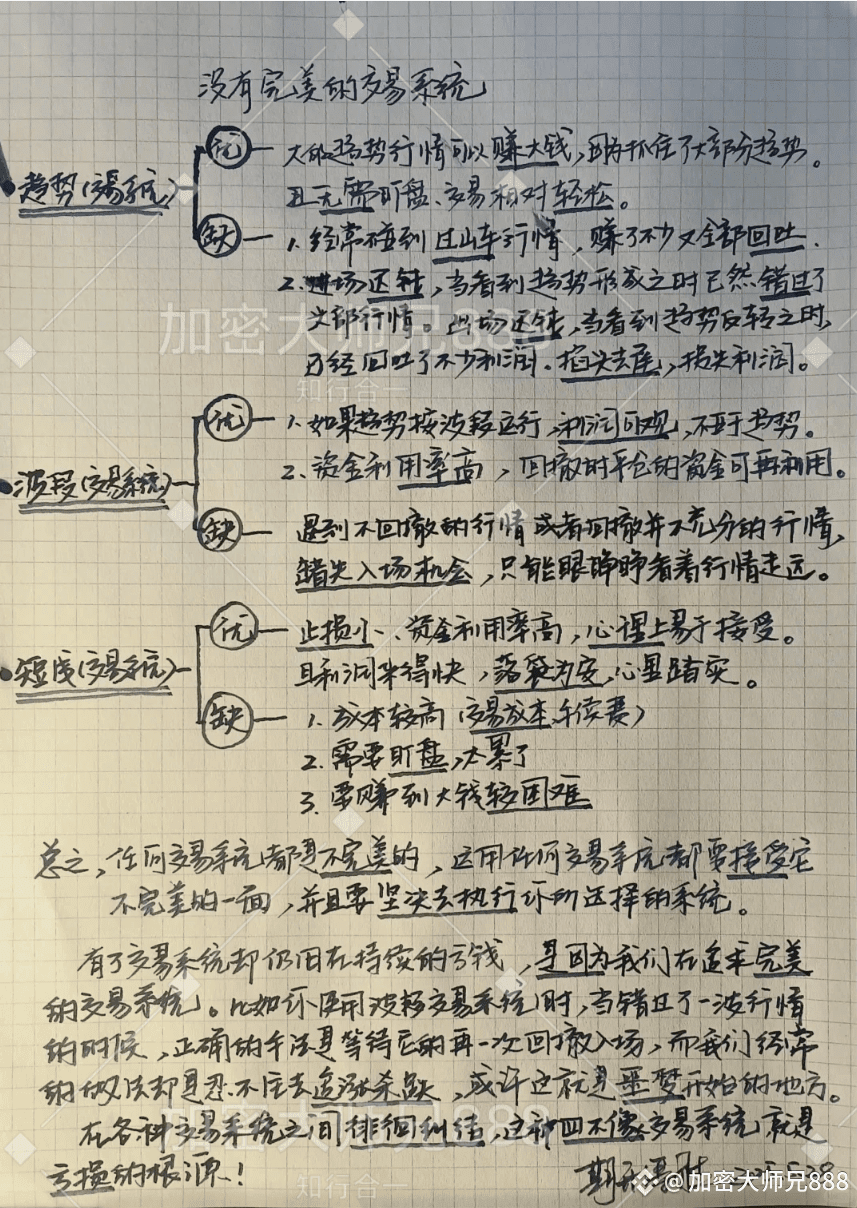
So how can you excel at cryptocurrency trading? Once a person enters the financial market, it is hard to turn back. If you are currently losing and still feeling lost, yet plan to treat trading as a second profession, you must know the 'Bollinger Band indicator techniques.' Understanding them can save you many detours from personal experience. I suggest you collect this knowledge and ponder it repeatedly!
Indicator Introduction
I. The Principles of Bollinger Bands
Bollinger Bands were created by the famous analyst John Bollinger.
Its principle is rooted in the normal distribution theory in statistics.
Although short-term fluctuations in financial asset prices may seem random,
However, in the long term, prices will tend to fluctuate around a central value (mean) regularly.
This characteristic aligns closely with the feature of data surrounding the mean in normal distribution.
1. Core Statistical Basis
In the normal distribution curve.
About 68% of the data falls within the mean ± 1 standard deviation range.
About 95% of the data falls within the mean ± 2 standard deviations range.
About 99.7% of the data falls within the mean ± 3 standard deviations range.
Bollinger Bands utilize this characteristic by treating price fluctuations as "random variables that conform to a normal distribution," calculating the mean of the price series.
Values and standard deviations dynamically construct reasonable boundaries for price fluctuations.
John Bollinger found through extensive backtesting that
The moving average calculated over a 20-day period serves as the mean (middle band), with ±2 standard deviations overlaying as the upper and lower bands.
Can most accurately capture the normal fluctuation range of prices.
— About 95% of price data falls within this range.
The portion that exceeds the range can be seen as "abnormal fluctuations."
This is also the core logic of Bollinger Bands for judging overbought and oversold conditions.
2. The underlying logic of dynamic adjustment.
Price fluctuations exhibit "congregation."
When the market is calm, the fluctuation range is small (standard deviation is small), and the bands narrow.
When the market changes dramatically, the fluctuation range is large (standard deviation is large), and the bands expand.
This self-adjusting characteristic allows Bollinger Bands to adapt to "narrow fluctuations" during consolidation.
It can also cope with the "wide fluctuations" of trending markets.
Avoids the failure of fixed range indicators in extreme market conditions.
II. Components of Bollinger Bands
Bollinger Bands are mainly composed of three bands: the upper band, middle band, and lower band.
Middle Band: Typically a moving average line, the most commonly used is the 20-day moving average. It reflects the medium-term trend of prices.
Generally will fluctuate around the middle band.
Upper Band: Calculated by adding two standard deviations to the middle band. It represents the pressure level for prices when they rise near the upper band.
When prices rise, resistance may be encountered.
Lower Band: Calculated by subtracting two standard deviations from the middle band. It represents the support level for prices when they fall near the lower band.
When prices rise, support may be encountered.
These three bands form a channel-like area where prices mostly operate within this channel.
III. Core Usage of Bollinger Bands
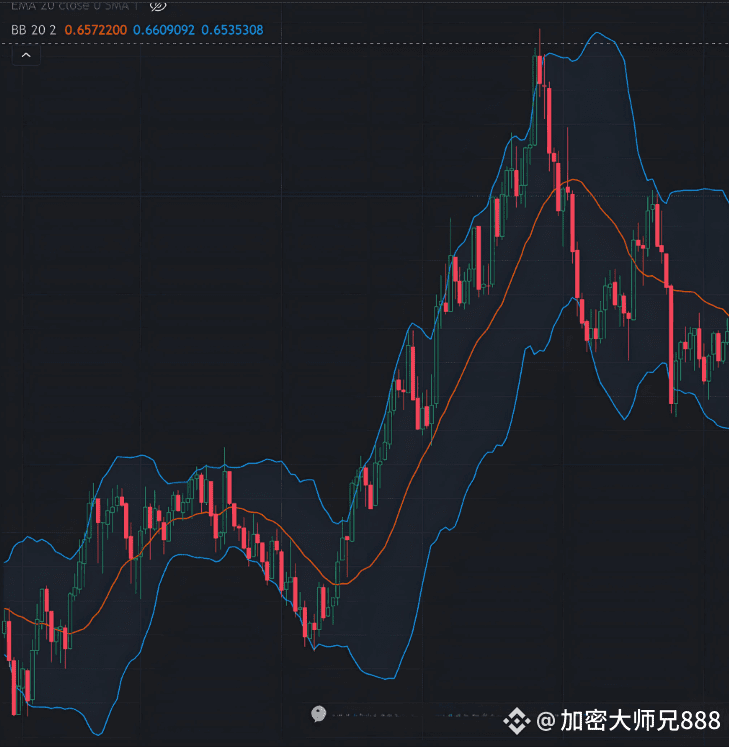
Stock prices operate within the bands: when prices fluctuate between the upper and lower Bollinger Bands.
And when the middle band shows a certain trend, it indicates that the prices are in a normal fluctuation state.
If the price runs upward along the middle band and fluctuates between the middle band and upper band,
Typically indicates an upward trend: If the price runs downward along the middle band.
And if it fluctuates between the middle band and lower band, it may be in a downward trend.
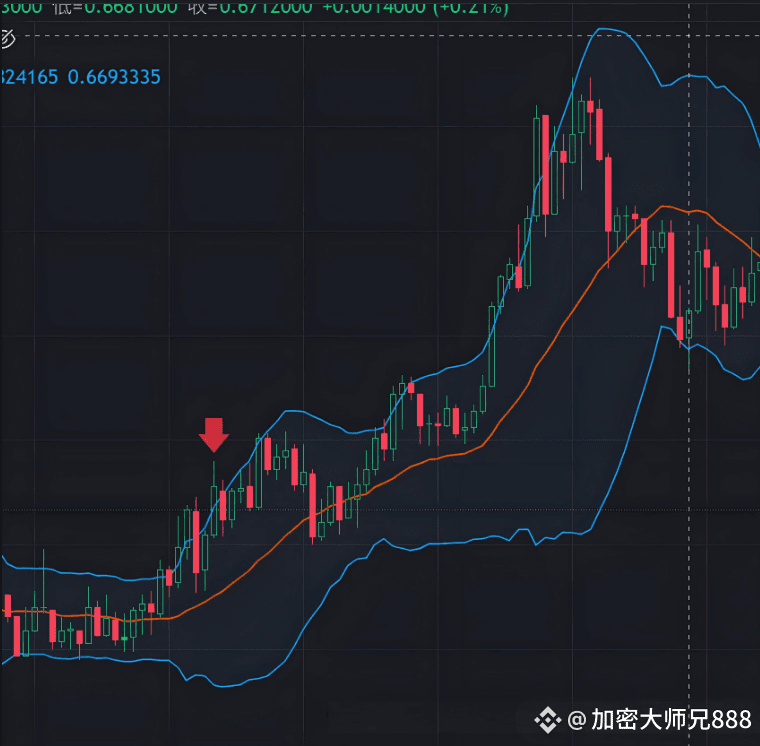
Price Breaks the Bands: When the price breaks above the upper band, it may indicate that the market is in an overbought state, and a price correction may follow.
When the price breaks below the lower band, it may indicate that the market is in an oversold state, with a potential price rebound to follow.
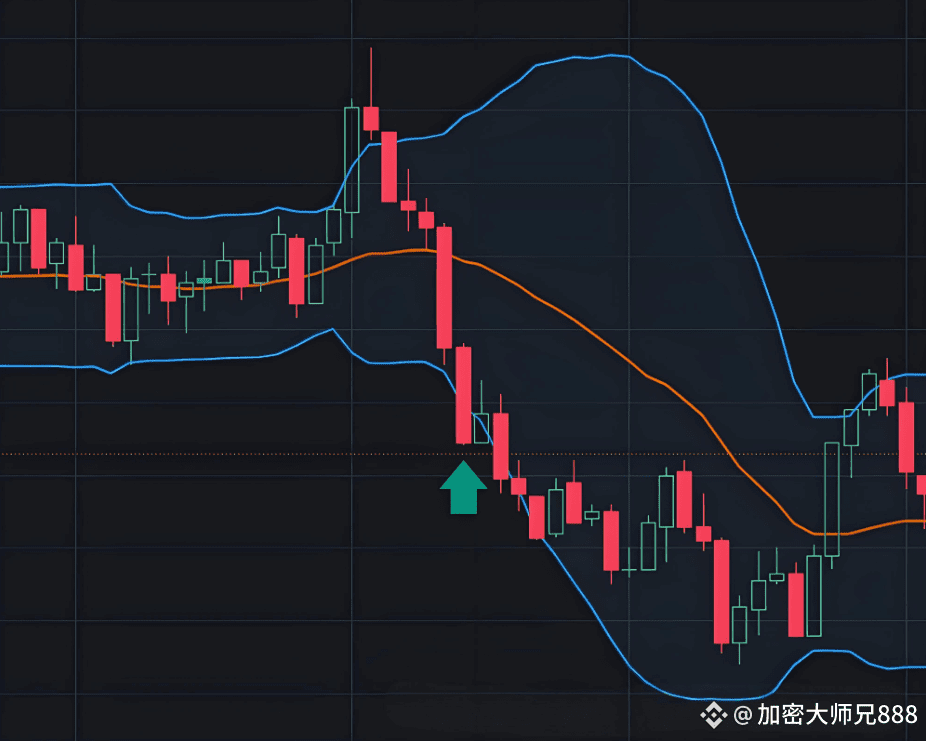
As shown in the image, buying when breaking down will only lead to greater losses.
It is important to note that a breakout does not necessarily mean a trend reversal, sometimes it may signal an acceleration of the trend, requiring a comprehensive judgment in conjunction with other indicators.
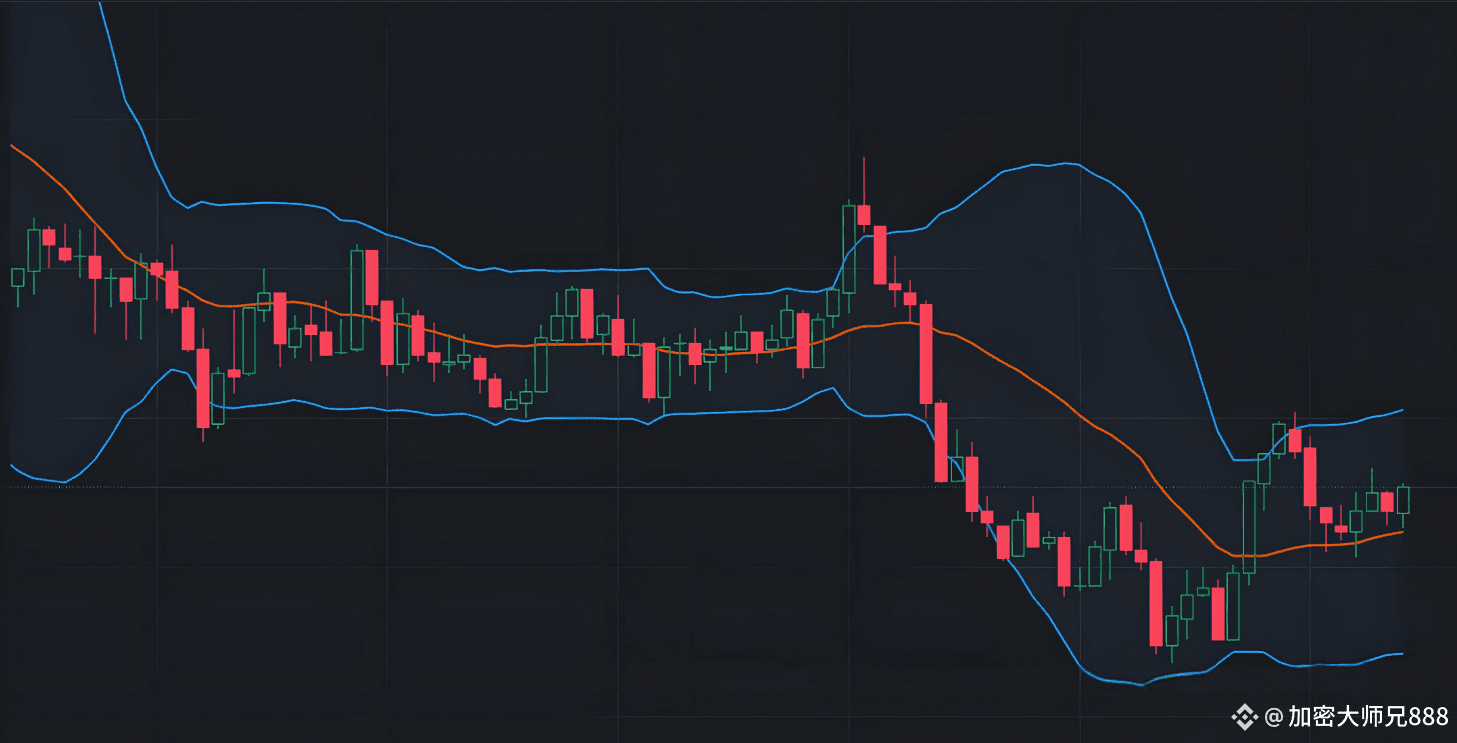
Band Contraction and Expansion:
When the Bollinger Bands contract, it indicates that the price's fluctuation range is decreasing, and the market is in a consolidation state, which may lead to significant volatility later.
When the bands expand, it indicates that the price's fluctuation range is increasing, and the market trend may be strengthening.
IV. Applicable Perspectives of Bollinger Bands
Bollinger Bands are applicable to various financial markets such as stocks, futures, and foreign exchange, as the prices in these markets exhibit certain fluctuation patterns that can be analyzed through Bollinger Bands.
Applicable Period: Whether for short-term intraday trading, medium-term swing trading, or even long-term trend judgments, Bollinger Bands can be effective.
However, the parameters of the Bollinger Bands may need to be appropriately adjusted across different periods.
Limitations: While Bollinger Bands are practical, they also have certain limitations.
A breakout above does not necessarily indicate a price correction.
It cannot be used as the sole basis for trading decisions. It must be combined with other indicators such as trading volume and MACD to improve judgment accuracy.
Additionally, in extreme market conditions, prices may spend long periods outside the Bollinger Bands, during which the reference significance of the bands diminishes.
In summary: Bollinger Bands are a simple and effective technical indicator. Understanding its principles, components, core usage, and applicable perspectives can provide
Our investment decisions are strongly supported.
This is the most practically meaningful Bollinger Band strategy. These techniques can be applied across different markets, different assets, and different periods, suitable for most traders to learn and use.
Even the most diligent fisherman won't go out to sea during a storm but will instead guard his boat carefully, knowing that the storm will pass, and sunny days will come! Follow @crypto_master888 to learn both how to fish and how to fish for fish, the door to the crypto world is always open. Only by going with the trend can you have a life that flows with it; collect this knowledge and keep it in mind!