$HBAR observes sustained negative net flows and strong dominance of long accounts on #Binance , indicating increasing investor confidence.
Hidden bullish divergence on the 4-hour RSI strengthens the case for the continuation of the upward trend.
Price action $HBAR demonstrates an ascending triangle, with $0.27 as the first breakout trigger and $0.29 as the key Fibonacci resistance level.
Sustained outflows indicate holder confidence.
HBAR recorded two consecutive weeks of strong negative net flow: –$46.49 million and –$40.85 million. This indicates a clear trend of token withdrawals from exchanges, which is typically a bullish signal reflecting investor confidence and a reduced likelihood of immediate selling pressure.
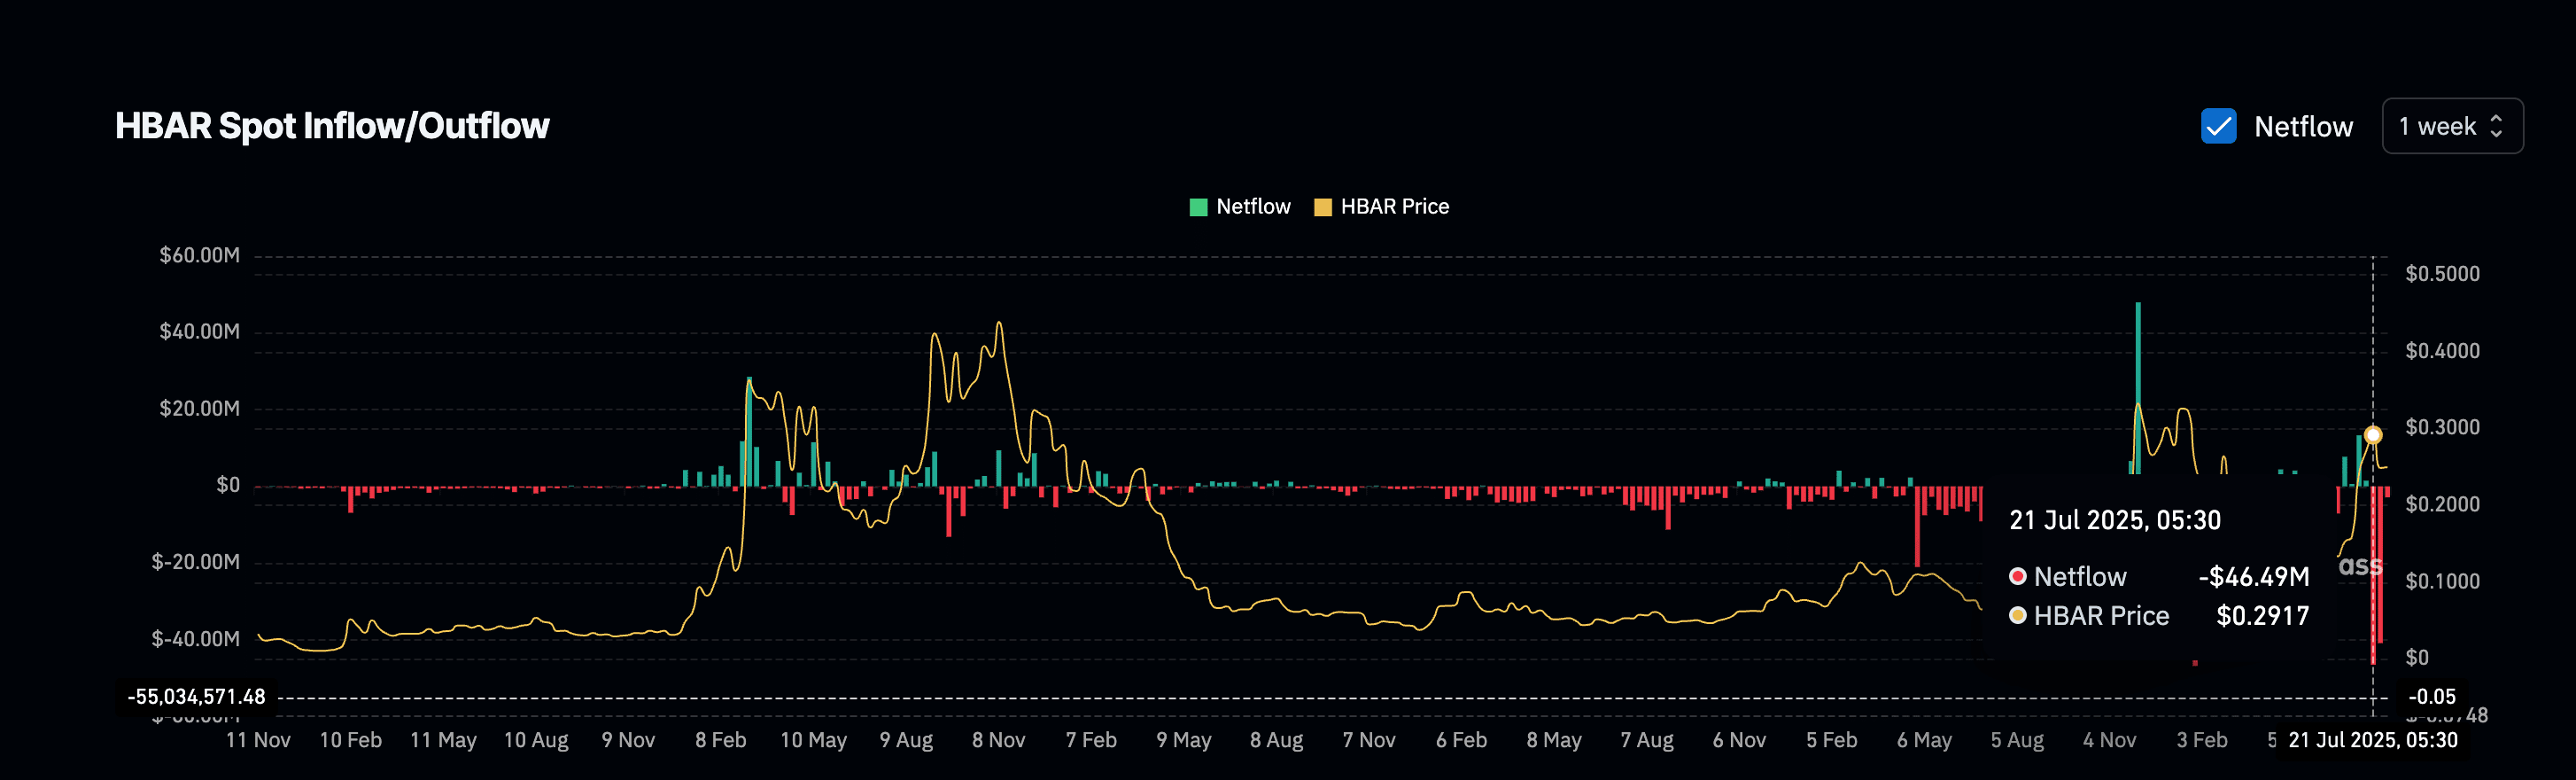
HBAR price and sustained weekly outflow: Coinglass
The new week has just begun, and traders should watch for the next stage of outflow. The third week of negative net outflow will further strengthen the accumulation trend.
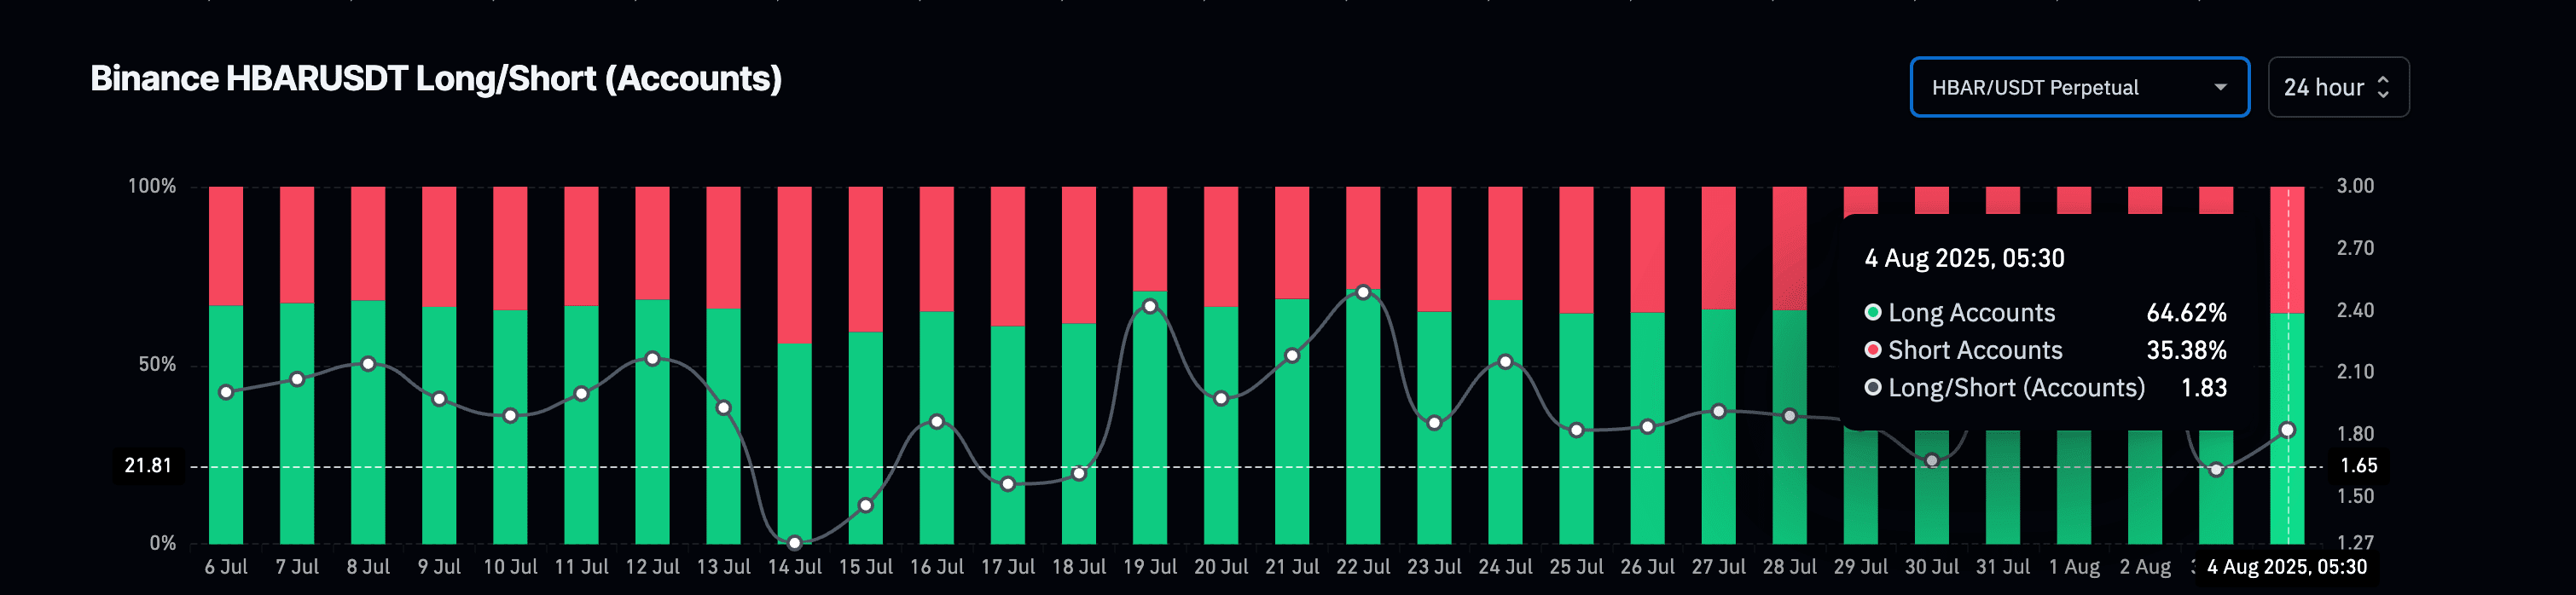
HBAR price and long/short accounts on Binance:
This is confirmed by the ratio of long to short positions on #Binance which is around 1.83. This means that almost two-thirds of accounts trading HBAR are taking long positions. Unlike the volume ratio of long and short positions, which tracks trade volumes, this metric reflects how many traders are betting on price increases. Collectively, a sustained outflow of funds and a high proportion of long positions confirm the presence of a bullish trend in the market structure.
Short-term RSI divergence indicates the continuation of the bullish trend.
To get an early assessment of momentum, we switch to the 4-hour chart, which is ideal for tracking short-term trend changes. From August 1 to 4, the price formed a slightly lower high ($0.255-$0.253), but the RSI (relative strength index) rose from 42 to 52 during the same period.
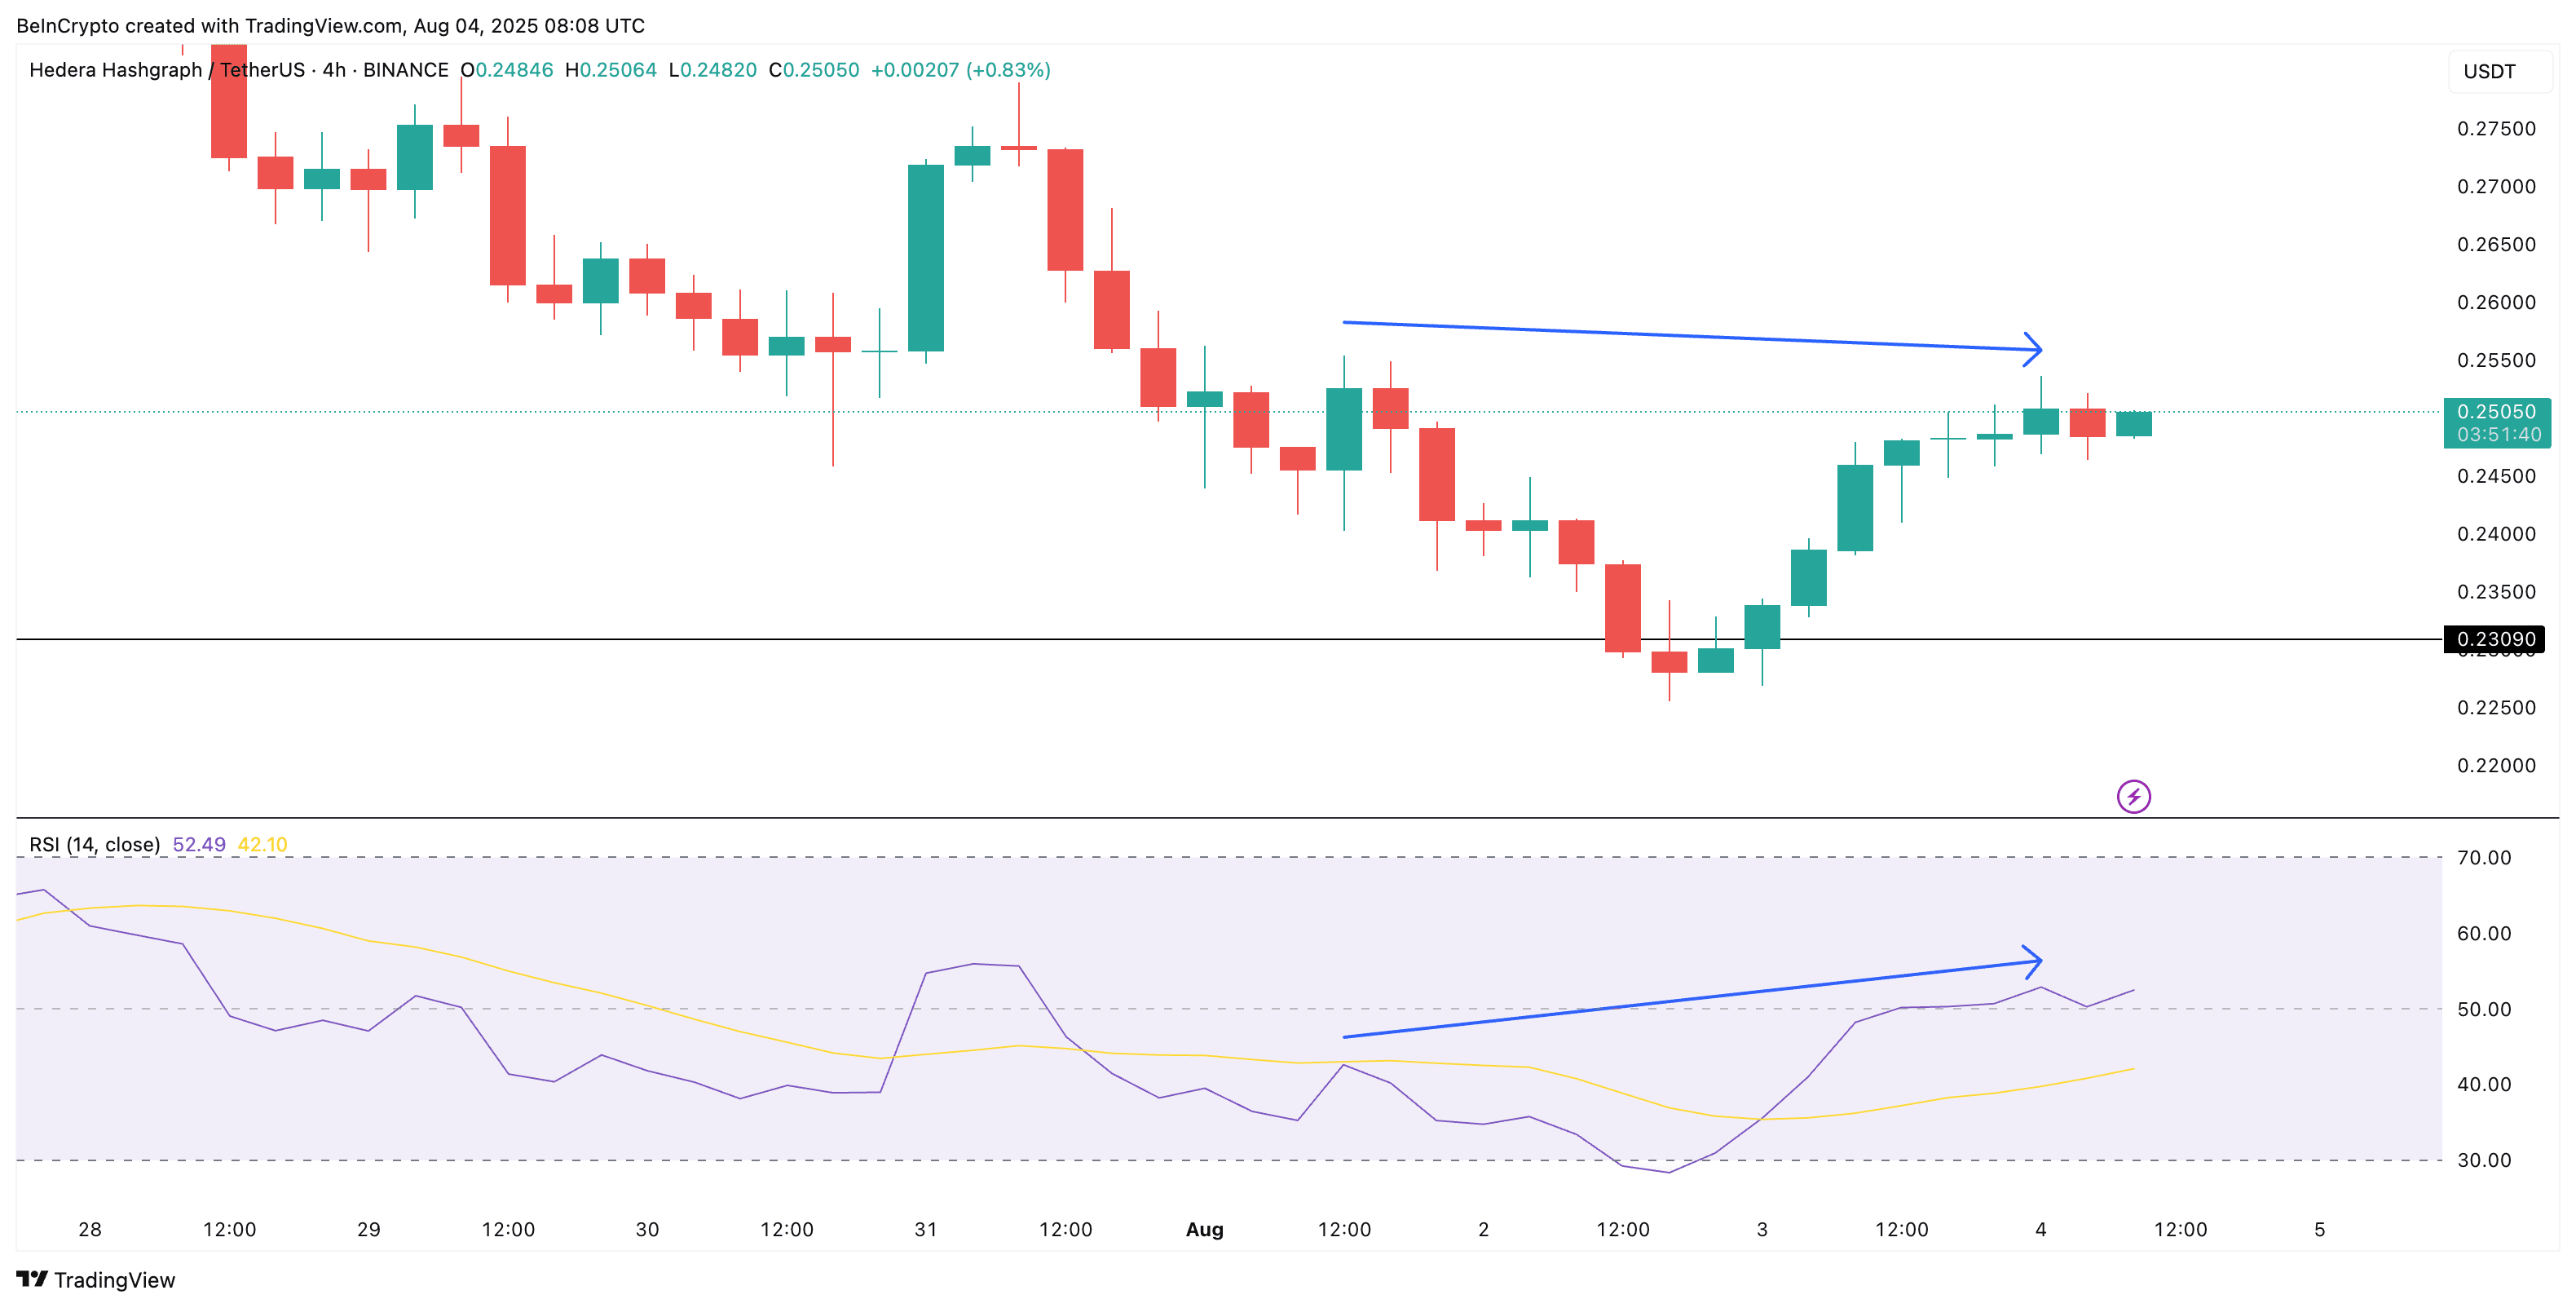
Bullish RSI divergence: TradingView
This is a classic case of hidden bullish divergence, which signals the continuation of the upward trend rather than its reversal. Although it is not a trigger for a breakout by itself, in combination with net flow data and positioning, it supports arguments for a sustainable upward movement.
The price breakout model for HBAR depends on key Fibonacci levels.
HBAR forms a clear ascending triangle, a bullish continuation pattern. The ascending support line started in June, and horizontal resistance levels are constantly being tested for strength. A breakout above $0.27 will confirm this pattern, but $0.29 remains a key resistance level obtained using Fibonacci extension levels based on the trend (drawn from $0.12 to $0.29 with a retracement to $0.23).
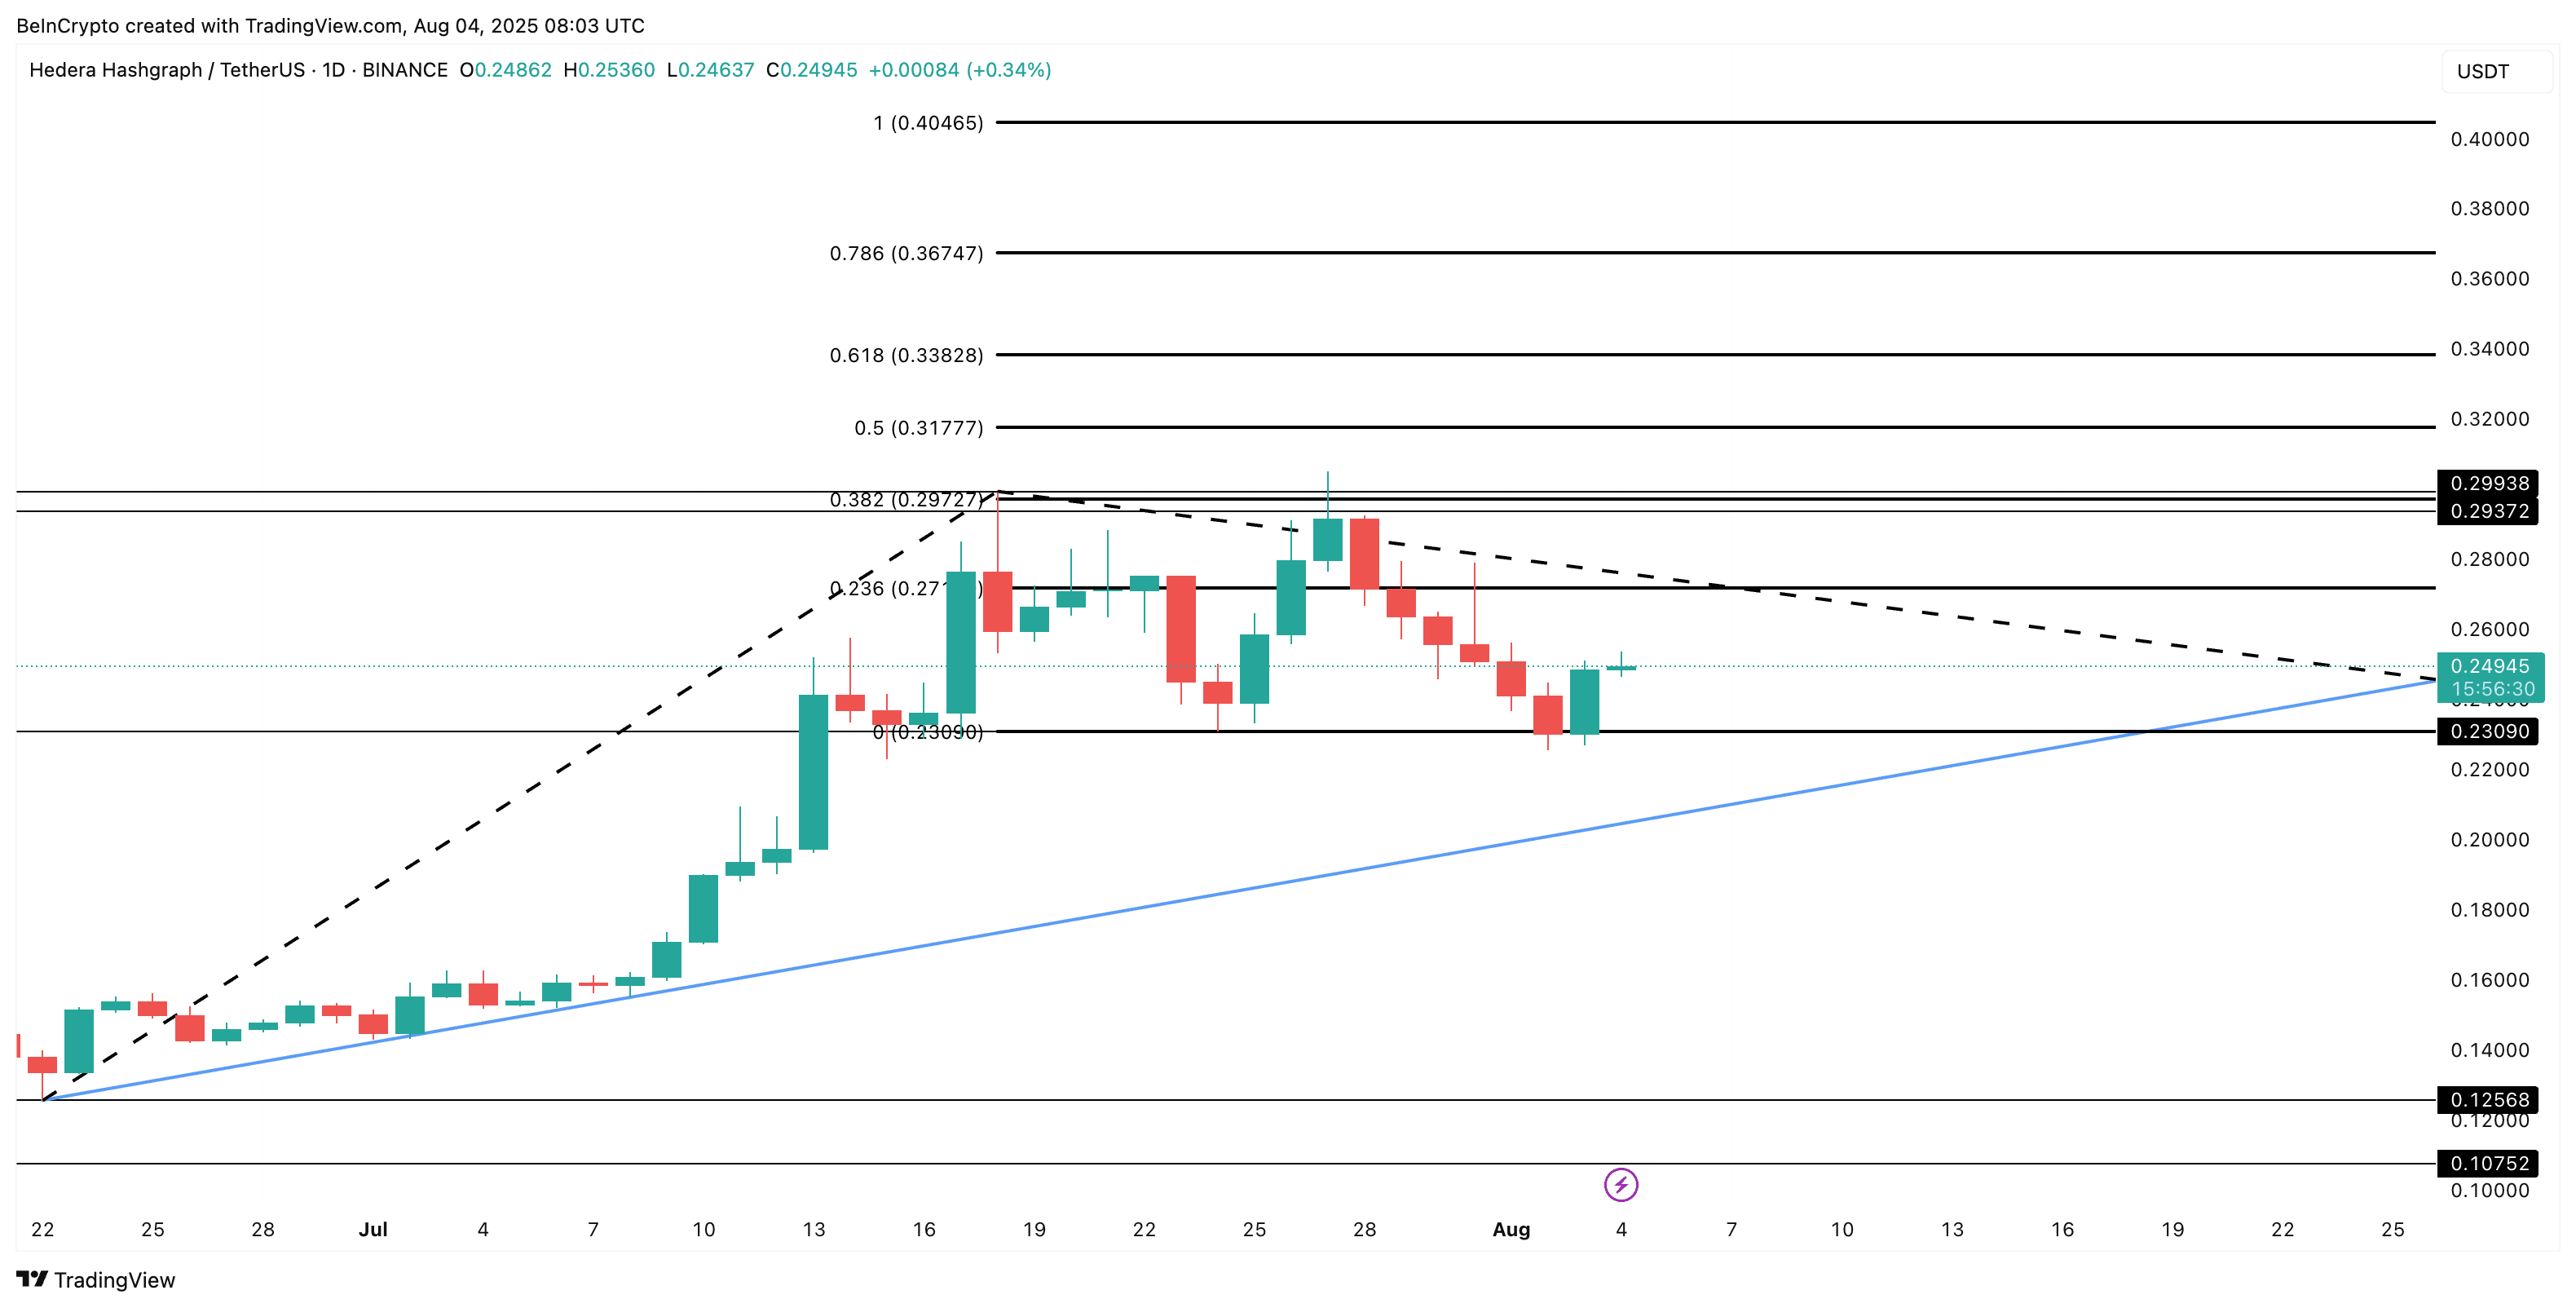
Fibonacci extension based on the trend is a tool that traders use to determine potential future support and resistance levels by predicting price movements from previous trend swings.
If the price $HBAR exceeds $0.29, it may accelerate to new swing highs. On the other hand, a drop below $0.23 would invalidate the short-term bullish outlook, but the broader structure will not transition into a bearish trend unless the HBAR price breaks below the lower trend line of the triangle.
