🐶 [Dogecoin Returns to Bull Market Track? Opportunity is Here Again!] 📈
Recently, Dogecoin has steadily returned to a key 'technical support convergence zone' on the weekly chart, which many investors see as an excellent opportunity to 'pick up bargains!' 👀
Market observer @cantonmeow (our familiar Cantonese Cat) posted a TradingView chart, sharing the image while quietly revealing: 'Last night I added some Dogecoin and Shitcoin, and you probably guessed it~ This wave looks like an extremely high risk-reward ratio; I'm all in.' 💥
He puts it quite plainly, but the technicals on the chart are indeed strong—Dogecoin has completed the breakthrough and retest of the diagonal bearish trend line and is currently retesting the so-called 'Bull Market Support Zone.' 📉➡️📈
If you are still hesitating, you might want to keep a close eye on the upcoming trends. Perhaps this bull market train is just missing your ticket! 🚀✨
🐶 [Is the best buying point here? Dogecoin quietly retests the 'Bull Market Support Zone'!] 📉➡️📈
On August 3rd, someone quietly drew a 'mysterious trajectory' on the chart, marking the key weekly trend of Dogecoin/USD—results show: Dogecoin has firmly stepped into the technical indicator area known as the 'Bull Market Support Zone!' This area is not just casually mentioned; it consists of two lines that form an envelope, specifically designed to capture potential rebound positions~ 👀
📍 The current bull market support zone is between $0.19025 and $0.20703, and Dogecoin has been testing this range back and forth this week, just like 'testing the water temperature.' The K-line data at the time of the screenshot is:
Opening Price O: $0.24076
Highest Point H: $0.24860
Lowest Point L: $0.18855
Closing Price C: $0.19945
📉 Overall, it has dropped about 17.15% within a week, but this is not bad news! You read that right, standing firm in the key support area after a significant drop often means what? Opportunity! 💡
Looking back, this is the first deep correction after Dogecoin's consecutive two-week surge. When it previously broke through $0.20, market sentiment was very optimistic. Now it’s just a slight 'cooling down'; the selling pressure is not as fierce as before, and this dip feels more like a retest, not a crash.
⚠️ So, for friends patiently waiting for opportunities, this technical retest may be the ideal 'entry signal!' If all goes well, this bull market support zone is expected to become the starting point for the next surge~
📌 A reminder: Don’t blindly FOMO, but also don’t miss out on good price points. During market fluctuations, calm observation + rational judgment = the best partners for entry! 💪🚀
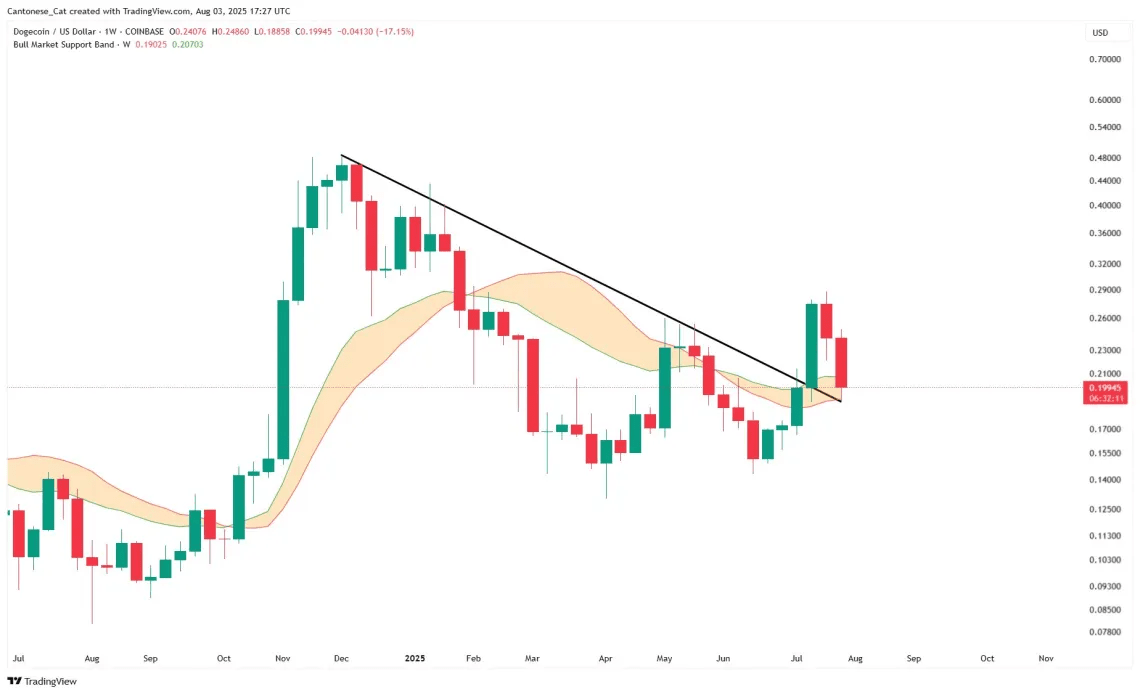
Dogecoin Price Analysis | Source: X@cantonmeow
📈 [Dogecoin 'God Chart' Exposed! Is around $0.19 the starting point for a bullish counterattack? 🐶] 💥
Do you really think this recent retest of Dogecoin is a 'drop'? In fact, from a technical perspective, it seems more like it's brewing a 'comeback'! Let's break down this weekly chart that has gone viral in the crypto space and see how the analyst interprets it~ 🔍
📊 Key Point One: Bull Market Support Zone x Downward Trend Line = Golden Convergence Point?
The most eye-catching part of the chart is not just the 'Bull Market Support Zone' between $0.19~$0.21, but also a 'Downward Trend Line' that runs through the entire correction phase. This line has suppressed the price from earlier highs until July 16, when Dogecoin broke through! And now, the price is precisely retesting the intersection of these two technical points.
💡 Attention! This position is not just a casual step; it is the 'confirmation point' loved by technical analysts! Trend followers often focus on such key convergence areas, and if the price stabilizes, it usually means that the breakout is real and there may be a new round of significant gains ahead!
📉 Key Point Two: A retest ≠ a crash; is it gathering strength to rise again?
There are always people in the market who shout 'it's over' at the first sign of a drop, but this analyst nicknamed 'Cantonese Cat' has a completely different view. He clearly stated in the chart: this is not a crash, it's a retest.
It's very simple: Dogecoin has previously broken through the long-term downward trend line, and now it is just 'stepping' to confirm whether the support is solid. If this position holds, it could be the starting point for the next wave of increases! 🪜📈
📌 The current price is at $0.199, perfectly positioned within the support zone! From a risk control perspective, it is easy to set a stop loss, the downside is limited, and the upside is wide. Doesn't that sound appealing? 😋
📉 Key Point Three: Weakening momentum + Range support = Bullish opportunity?
Experienced traders understand that the key is not just 'how much the price has dropped,' but whether the decline is slowing down, and if there are signs of 'volume reduction during the retest' and 'momentum weakening.' 📉➡️📊
The current chart reflects this change in rhythm, and coupled with stabilizing at the edge of the bull market support area, the bulls indeed have a chance to regain control.
🧠 'Cantonese Cat' directly said in the comments: 'I think this is a great risk-reward.' This actually hides a trick—when the market retests the key support area and momentum weakens, setting a stop loss may be a good time for 'buy low and sell high.'
🧐 Conclusion: The chart does not provide guarantees, but opportunities!
Ultimately, this is just an analyst's interpretation of the current chart, not an absolute prophecy. However, from the chart's perspective, Dogecoin has already broken through long-term resistance and is currently 'applying the brakes' at a key position. As long as it can stabilize this week, the next explosion may be in sight!
👀 Therefore, bulls should keep a close watch on this volatility. This could be one of those **'missed the boat'** opportunities or just a 'failed confirmation' false breakout. The key is how the market behaves next.
📍 Currently, DOGE's price is at $0.199, just a step away. Whether it rises or stabilizes depends on how it performs~ 🎬#Dogecoin
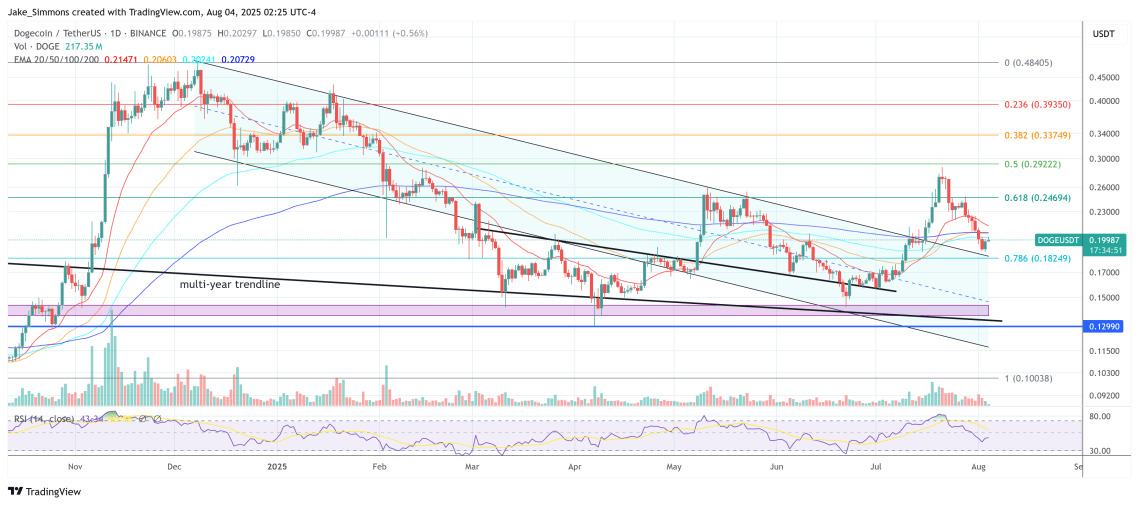
DOGE Price, 1-Day Chart | Source: DOGEUSDT on TradingView.com
