
Dogecoin's weekly chart has returned to a group of technical thresholds that a market observer believes creates a favorable entry point. The anonymous trader Cantonese Cat (@cantonmeow) posted a snapshot on TradingView and wrote: "I bought a little more DOGE and Fartcoin last night, but I'm sure you all know that. I think this is a great risk-reward ratio, and anyway, I will do my best to buy in."
In a subsequent note attached to the chart, the analyst summarized this setup as follows: "Testing the DOGE bull market support band. Breaking the bearish market trendline and retesting."
Best Dogecoin Buy Signal?
The chart, created on August 3, tracks DOGE/USD (Coinbase) on a weekly timeframe and shows the price moving into the Bull Market Support Band—a envelope indicator drawn as two lines—currently marked around $0.19025–$0.20703.
At the time of the screenshot, the weekly candle shows O: $0.24076, H: $0.24860, L: $0.18855, C: $0.19945, reflecting a decline of about 17.15% for the week as trading has a few hours left. This drop follows a strong bullish run lasting two weeks, pushing Dogecoin above $0.20 before the selling pressure eased.
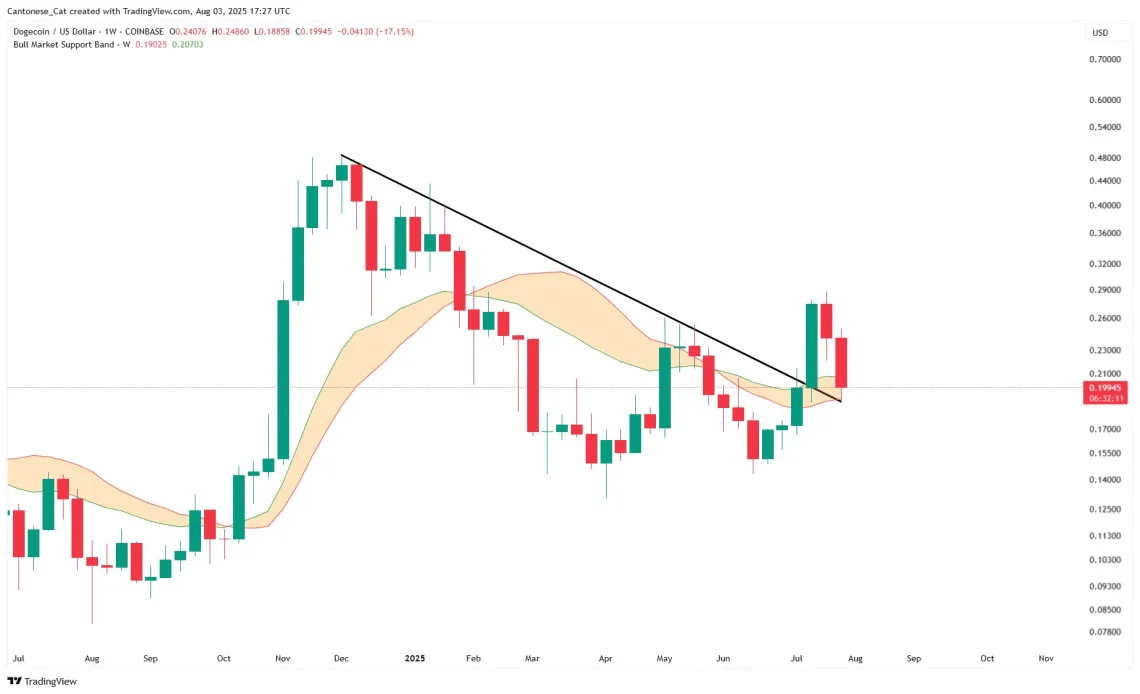
Technically, the image highlights two factors that extend beyond the support band. First is the descending trendline drawn through the lower highs of the week, which the price broke through on July 16 and is currently testing from above. Second is the intersection of that trendline and the bullish market support band, a zone that trend followers often watch to assess whether a breakout will hold or fail.
The analyst's article views the current pullback as a "back test" of both features rather than a breakdown, implying that demand near this band could help buyers maintain control if this level continues to act as support.
Although the article is clearly optimistic, the evidence presented is more descriptive than predictive. However, the weekly candle has closed above the critical zone. Thus, the configuration is clear: after breaking through long-term resistance, DOGE is returning to the $0.19–$0.21 area, where the support band coincides with the previous downtrend line.
Momentum and trend traders often assess such pullbacks to confirm—looking for stability, decreasing momentum, or a quick recovery back on the midline of the band.
Cantonese Cat's message distills that perspective into a simple risk stance. By stating, "I think this is a great risk-reward ratio," this commentator implies that, in his view, recent technical levels define tight risk relative to potential upside if the breakout is sustained.
As usual, this is a chart interpretation from an analyst at a specific moment; Dogecoin remains volatile, and this week will be crucial for buyers to try to confirm the upward momentum, but the risk-reward ratio looks quite good. $DOGE